
Orange harvest is declining in the USA
The US Department of Agriculture has updated the forecast of the orange harvest in 2016/17 agricultural season. It may be 14.8% less than in the 2015/16 season. Will orange juice prices advance?
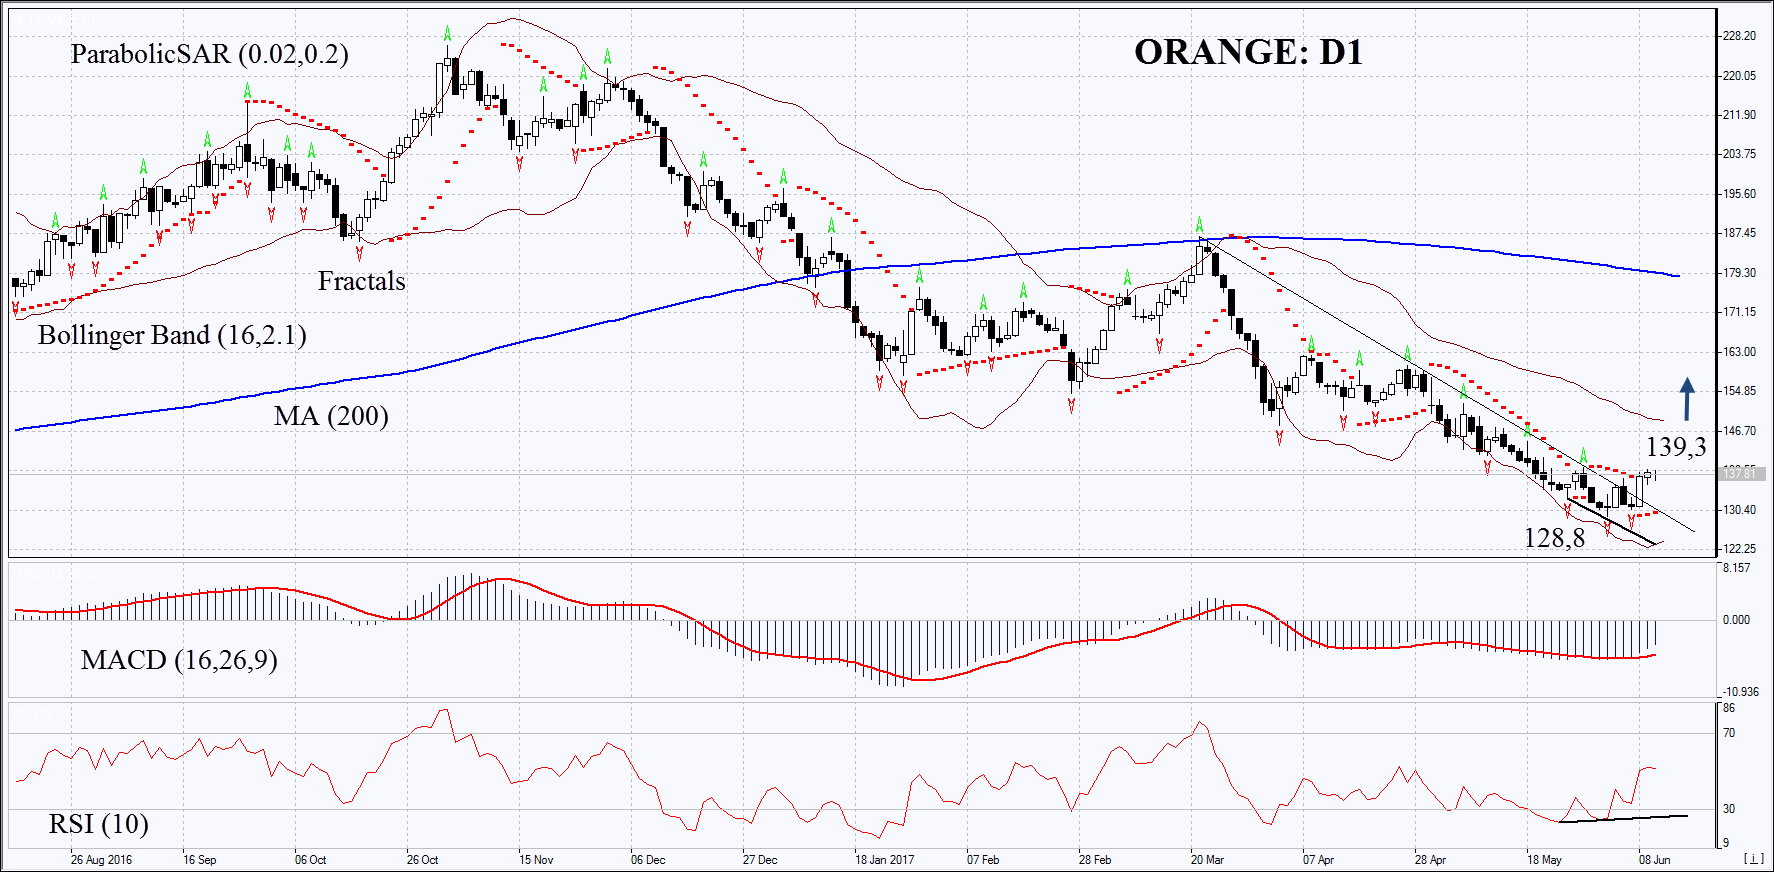
On the daily timeframe, Orange: D1 is trying to leave the downtrend to move upwards. The further price increase is possible in case of a decline in the orange harvest in the USA.
- The Parabolic indicator gives a bullish signal.
- The Bollinger bands have widened, which indicates high volatility. They are titled upwards.
- The RSI Indicator is near 50. It has formed a positive divergence.
- The MACD Indicator gives a bullish signal.
The bullish momentum may develop in case Orange exceeds the last fractal high at 139.3. This level may serve as an entry point. The initial stop-loss may be placed below the two last fractal lows and the Parabolic signal at 128.8. After opening the pending order, we shall move the stop to the next fractal low following the Bollinger and Parabolic signals. Thus, we are changing the potential profit/loss to the breakeven point. More risk-averse traders may switch to the 4-hour chart after the trade and place there a stop-loss moving it in the direction of the trade. If the price meets the stop level 128.8 without reaching the order at 139.3, we recommend cancelling the position: the market sustains internal changes that were not taken into account.
Summary of technical analysis:
| Position | Buy |
| Buy stop | Above 139,3 |
| Stop loss | Below 128,8 |