
Hot weather in the US increases demand for air conditioning
Hot weather is forecasted for the next 2 weeks in US and temperatures will be above the average for this period of year. Will natural gas prices rise? It is used to produce electric power for air conditioners.
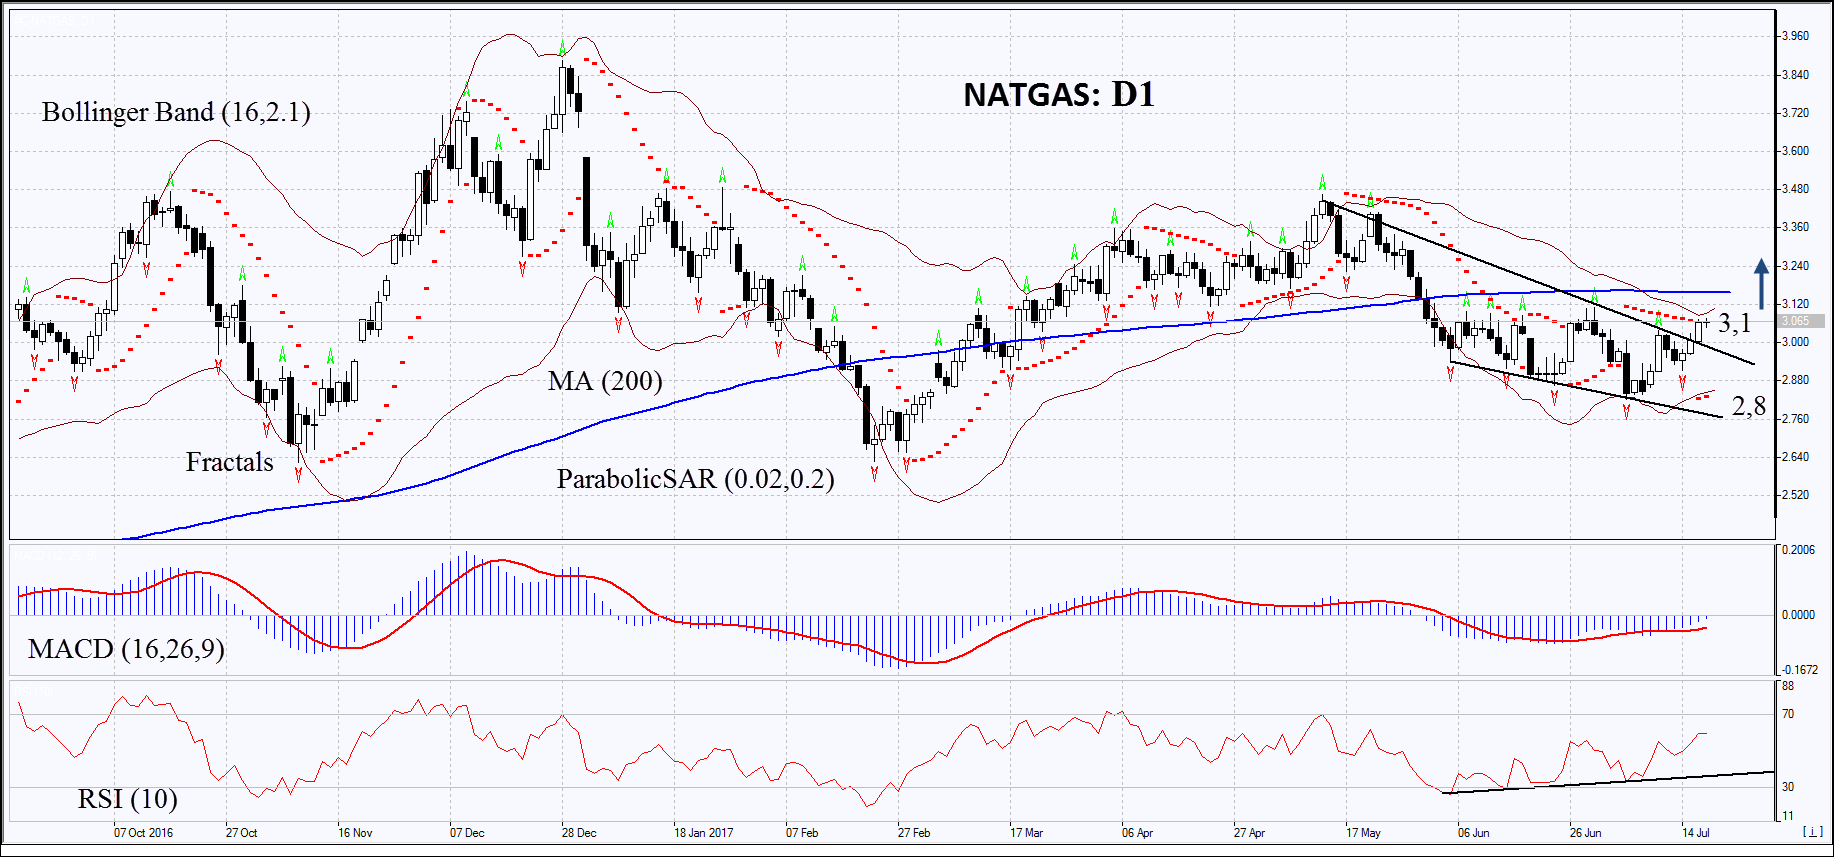
On the daily timeframe, NATGAS: D1 has edged up from the downtrend. The further price increase is possible in case of a reduction in natural gas production in the US, as well as in case of maintaining high demand against the background of increased electricity consumption for air conditioning.
- The Parabolic indicator gives a bullish signal.
- The Bollinger bands have narrowed, which indicates low volatility. They are titled upwards.
- The RSI indicator is above 50. It has formed a positive divergence.
- The MACD indicator gives a bullish signal.
The bullish momentum may develop in case Natgas exceeds the upper Bollinger band at 3.1. This level may serve as an entry point. The initial stop-loss may be placed below the two last fractal lows, the Parabolic indicator and the lower Bollinger band at 2.8. After opening the pending order, we shall move the stop to the next fractal low following the Bollinger and Parabolic signals. Thus, we are changing the potential profit/loss to the breakeven point. More risk-averse traders may switch to the 4-hour chart after the trade and place there a stop loss moving it in the direction of the trade. If the price meets the stop level at 2.8 without reaching the order at 3.1 we recommend cancelling the position: the market sustains internal changes that were not taken into account.
Summary of technical analysis:
| Position | Buy |
| Buy stop | Above 3,1 |
| Stop loss | Below 2,8 |