
Canada has overtaken the United States in supplying pork to China
The exports of pork from the USA in April 2017 decreased by 11. 6% compared to March and amounted to 462.9 million pounds. Will the lean hog prices fall?
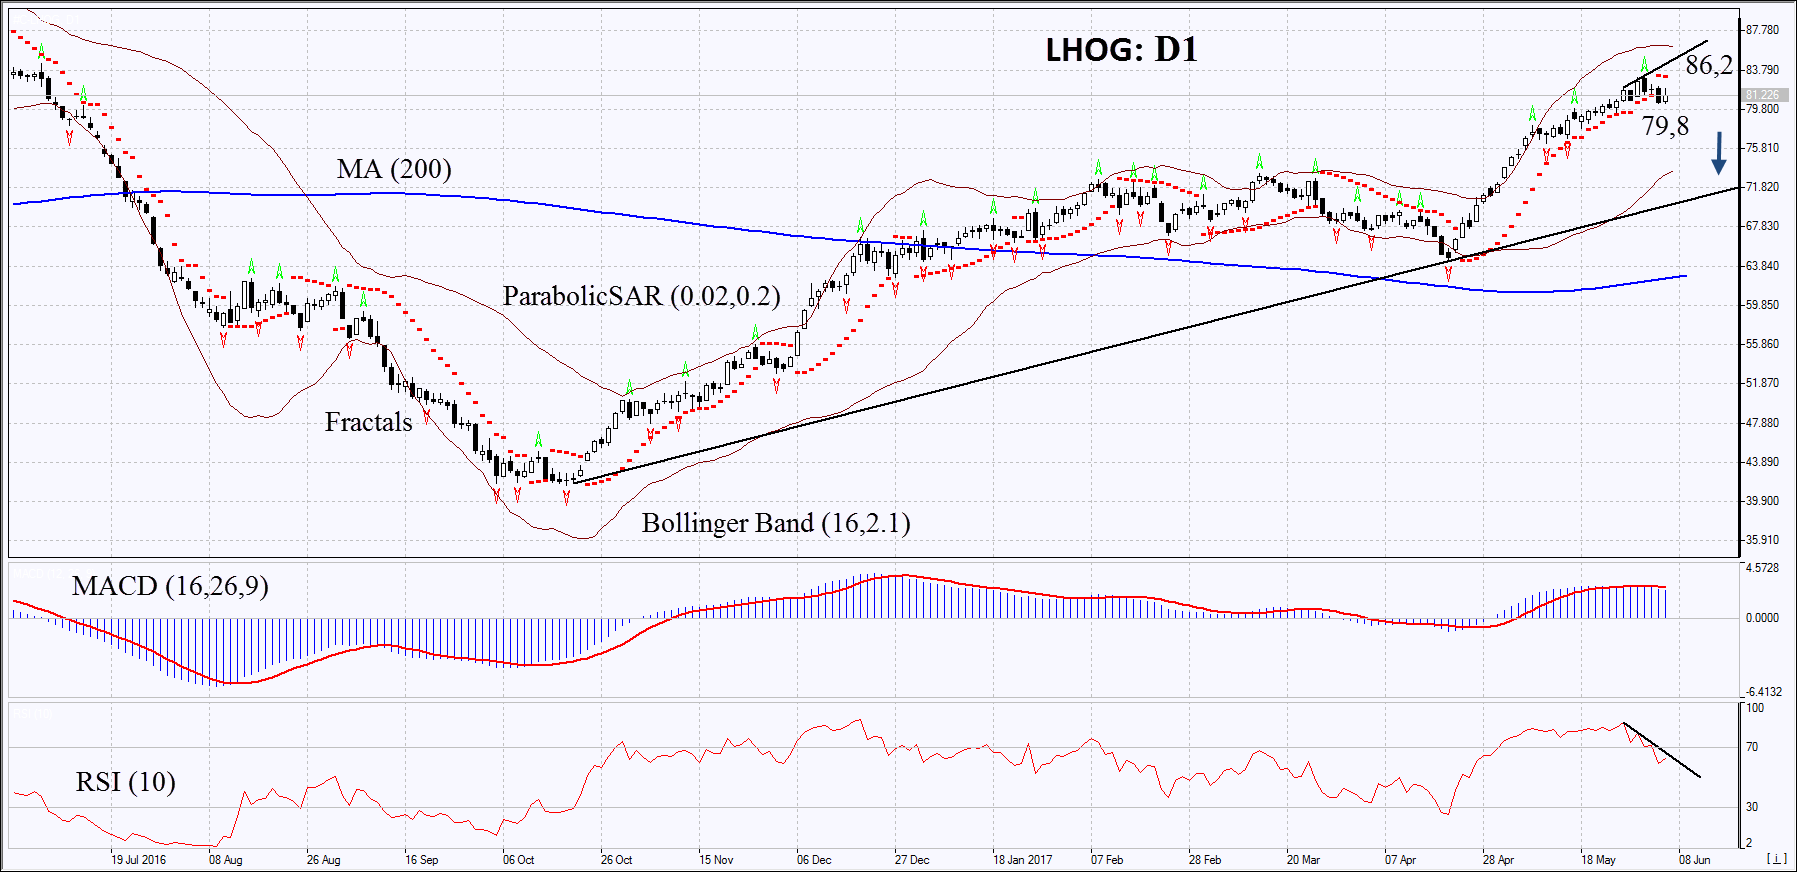
On the daily timeframe, LHOG: D1 continues to be in a rising trend. Over the past 7 months, the price has doubled. Now, the lean hog price is trying to correct down. The further price decline is possible in case of a reduction in world demand for meat in the summer.
- The Parabolic indicator gives a bearish signal.
- The Bollinger bands have widened, which indicates a high volatility.
- The RSI Indicator is above 50. It has formed a negative divergence.
- The MACD Indicator is giving a bearish signal.
The bearish momentum may develop in case LHOG falls below the recent low at 79.8. This level may serve as an entry point. The initial stop-loss may be placed above the last fractal high, the 10 - month high, the Parabolic signal and upper Bollinger band at 86.2. After opening the pending order, we shall move the stop to the next fractal high following the Bollinger and Parabolic signals. Thus, we are changing the potential profit/loss to the breakeven point. More risk-averse traders may switch to the 4-hour chart after the trade and place there a stop loss moving it in the direction of the trade. If the price meets the stop level at 86.2 without reaching the order at 79.8, we recommend cancelling the position: the market sustains internal changes that were not taken into account.
Summary of technical analysis:
| Position | Sell |
| Sell stop | Below 79.8 |
| Stop loss | Above 86.2 |