
Higher expected production is bearish for coffee prices
Coffee production in Uganda and Ethiopia is expected to rise in 2017-18. Will coffee prices continue falling?
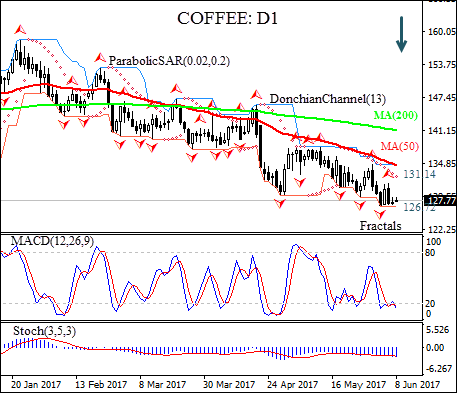
On the daily chart COFFEE:D1 is trading with negative bias since mid-January. Price is below the 50-day and 200-day moving averages MA(50) and MA(200), which are both falling and the gap between them is widening, which is a bearish signal.
- The Parabolic indicator gives a buy signal.
- The Donchian channel gives no signal: it is flat.
- The MACD indicator is neutral: it is below the signal line and the gap is steady.
- The stochastic oscillator is in the oversold zone.
We believe the bearish momentum will continue after the price crosses below the lower Donchian bound at 126.72. It can be used as an entry point for a pending order to sell. The stop loss can be placed above the last fractal high at 131.14. After placing the pending order the stop loss is to be moved every day to the next fractal low, following Parabolic signals. Thus, we are changing the probable profit/loss ratio to the breakeven point. If the price meets the stop-loss level (131.14) without reaching the order (126.72) we recommend cancelling the position: the market sustains internal changes which were not taken into account.
Summary of technical analysis:
| Position | Sell |
| Sell stop | Below 126.72 |
| Stop loss | Above 131.14 |