
A number of companies reported an increase in coffee drinks sales
A number of coffee companies as Canadian Spot Coffee, Vietnamese Vinacafé Bien Hoa, American KonaRed, Indian Tata Global Beverages reported an increase in sales. Can this indicate an increase in demand? Will the coffee prices advance?
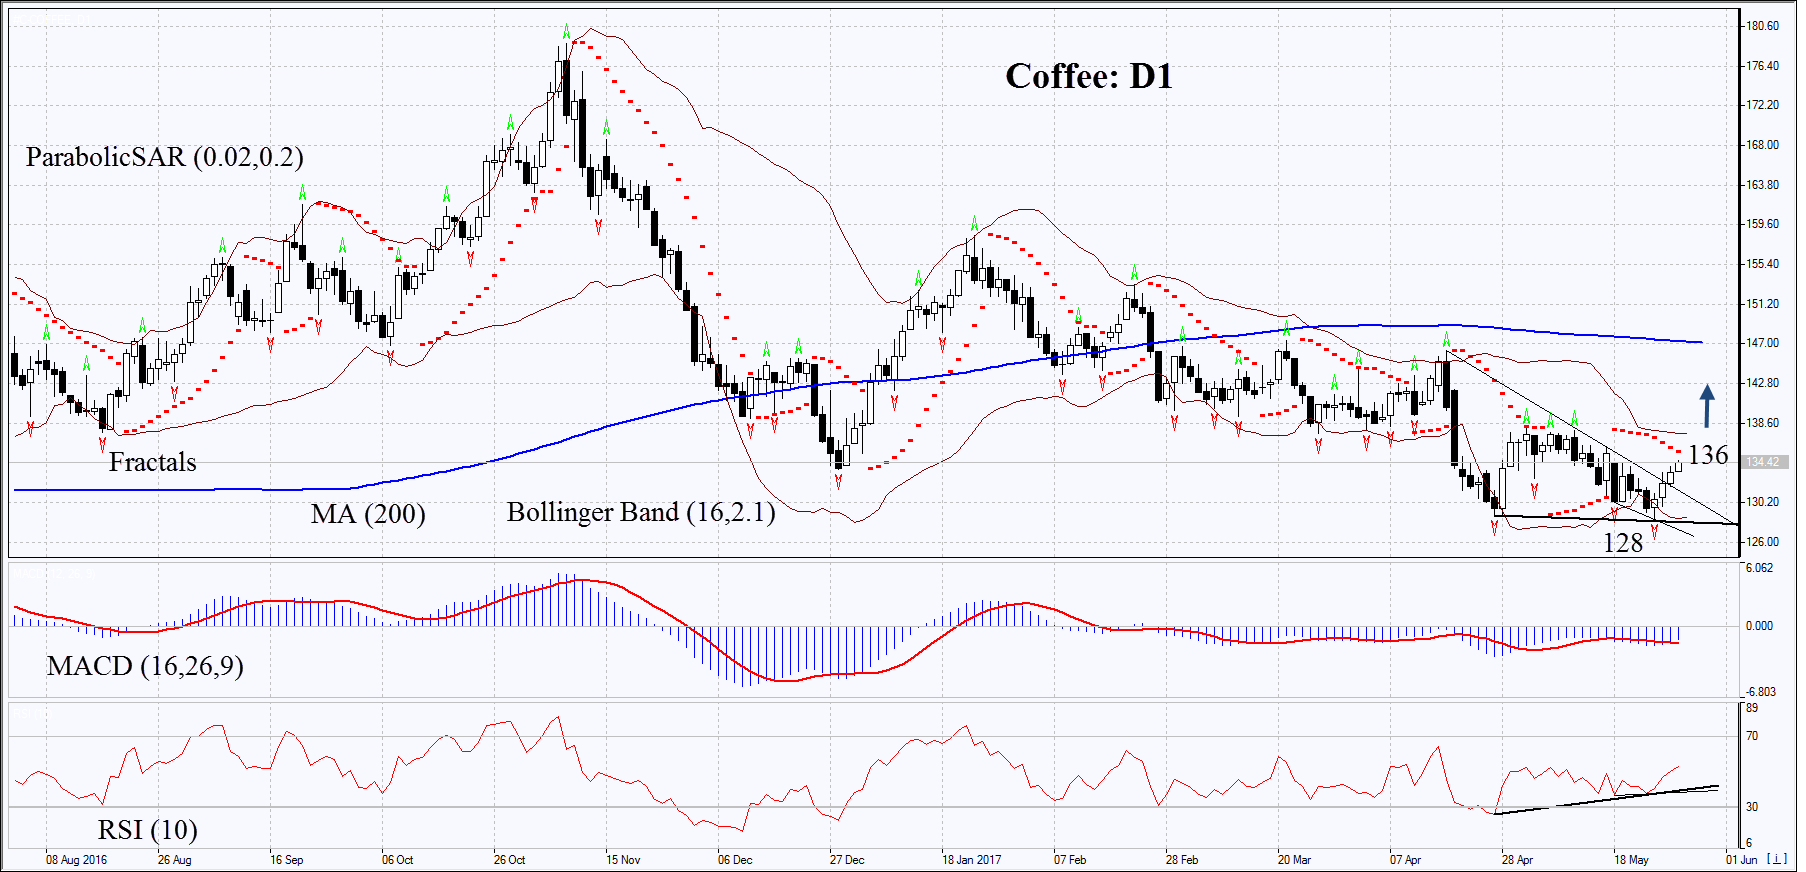
On the daily timeframe, Coffee: D1 is correcting upwards after updating the 11-month low. The further price increase is possible in case of the crop cuts because of bad weather and in case of higher global demand.
- The Parabolic indicator gives a bearish signal. It may be used as an additional resistance line, which should be overcome to open a buy position.
- The Bollinger bands have narrowed, which means lower volatility. They are tilted upwards.
- The RSI is above 50. It has formed a positive divergence.
- The MACD gives a bullish signal.
The bullish momentum may develop in case Coffee exceeds the Parabolic signal at 136. This level may serve as the entry point. The initial stop loss may be placed below the last fractal low, the 11-month low and the lower Bollinger band at 128. After opening the pending order, we shall move the stop to the next fractal low following the Bollinger and Parabolic signals. Thus, we are changing the potential profit/loss to the breakeven point. More risk-averse traders may switch to the 4-hour chart after the trade and place there a stop loss moving it in the direction of the trade. If the price meets the stop level at 128 without reaching the order at 136 we recommend cancelling the position: the market sustains internal changes that were not taken into account.
Summary of technical analysis:
| Position | Buy |
| Buy stop | above 136 |
| Stop loss | below 128 |