
Active rig count growth has slowed down in the US
The pace of growth of active rig count in the US has slowed down to a minimum since November of the last year. Will <a href="https://www.ifcmarkets.com/en/trading-conditions/commodities/brent?utm_source=financemagnates&utm_medium=Profile_listing&utm_campaign=News
">Brent prices continue rising?
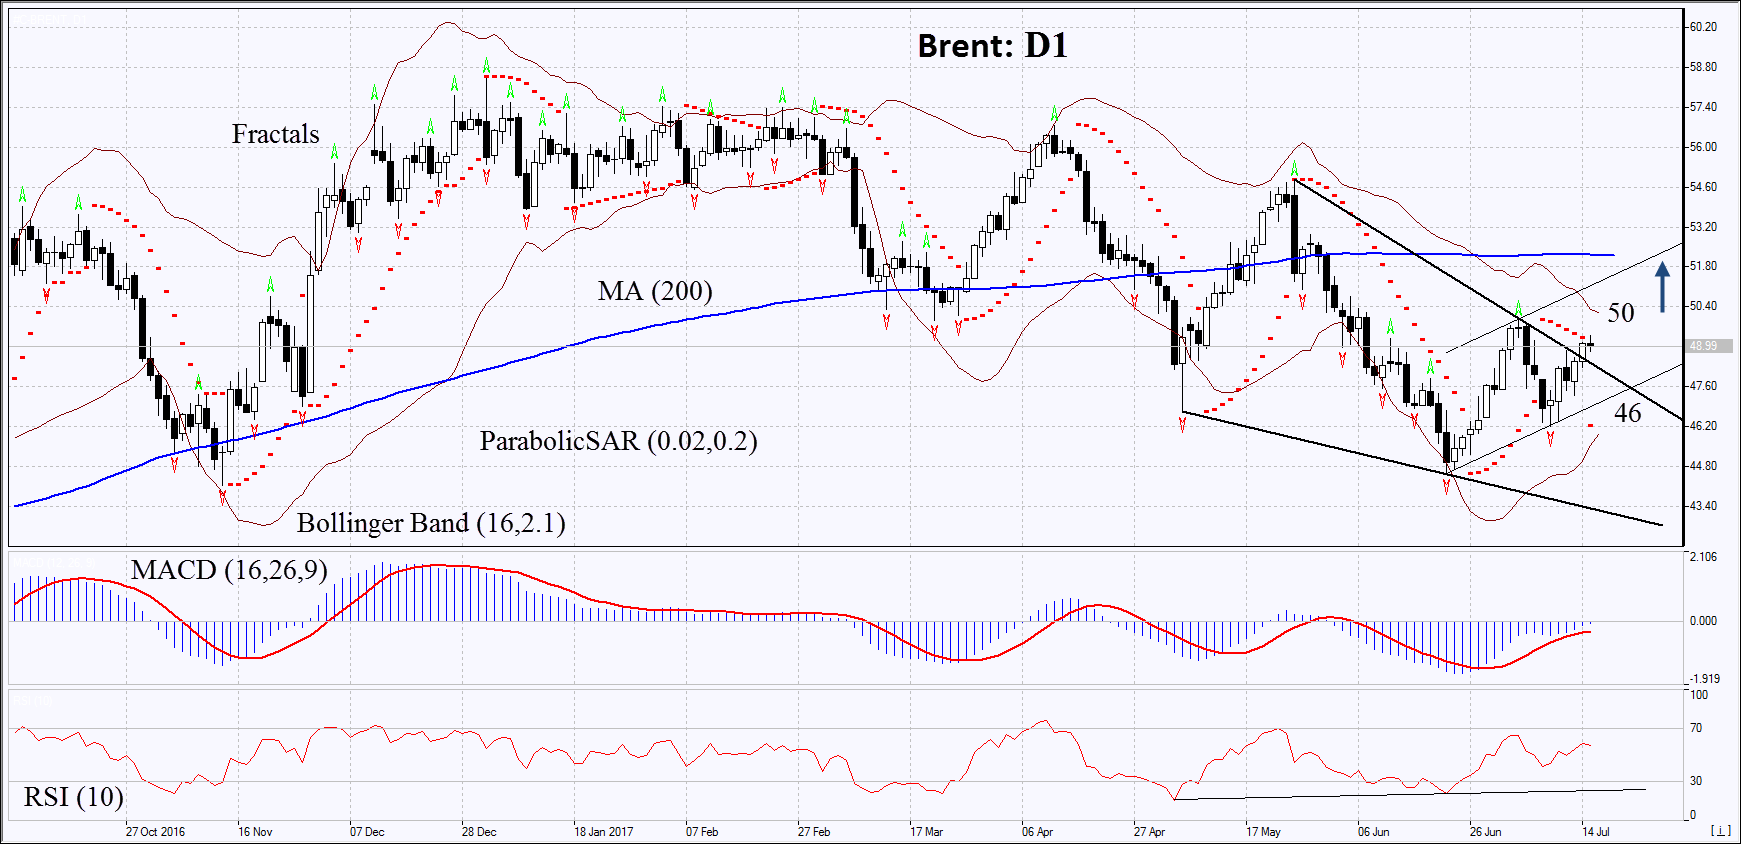
On the daily timeframe, Brent: D1is in a wide range of 57.5 – 44.5. A few weeks ago, it bounced off from its lower boundary and is moving to the upper boundary. The further price increase is possible in case of the reduction in oil production in the US and other countries, as well as in case of maintaining a high world demand.
- The Parabolic indicator gives a bullish signal.
- The Bollinger bands have narrowed, which indicates low volatility.
- The RSI indicator is above 50. No new divergence.
- The MACD indicator gives a bullish signal.
The bullish momentum may develop in case Brent exceeds the last fractal high at 50. This level may serve as an entry point. The initial stop-loss may be placed below the last fractal low, the Parabolic signal and the lower Bollinger band at 46. After opening the pending order, we shall move the stop to the next fractal low following the Bollinger and Parabolic signals. Thus, we are changing the potential profit/loss to the breakeven point. More risk-averse traders may switch to the 4-hour chart after the trade and place there a stop loss moving it in the direction of the trade. If the price meets the stop level at 46 without reaching the order at 50 we recommend cancelling the position: the market sustains internal changes that were not taken into account.
Summary of technical analysis:
| Position | Buy |
| Buy stop | |
| Stop loss | Below 46 |