
Rising output pressures Brent crude price
Brent price has been declining as Brent crude oil price has been declining after hopes started to fade that OPEC may succeed at reaching a deal to cut oil output at its November 30 meeting. OPEC members announced they agreed on a preliminary deal to limit production to 32.5 - 33 million barrels a day at a meeting in Algiers in September. But it looks less likely all 14 members will agree on who would be cutting output and by how much at OPEC’s summit on November 30. Iraq said last week it will need to keep pumping at current levels to generate revenue to be able to fight against the Islamic State. Iran, Libya and Nigeria are planning to ramp up output after years of declines due to sanctions and militant attacks. Goldman Sachs warned on October 31 oil prices could fall to the low $40s per barrel due to weakening oil fundamentals if OPEC fails to reach an agreement. Analysts point that Russian and overall OPEC production has continued to rise, adding to supply overhang. On Wednesday US energy Information Agency reported a surprise 14 million barrels increase in US crude stockpiles last week, the largest weekly build since the US Energy Information Administration started keeping records in 1982. At the same time total domestic crude production rose by 18000 barrels a day to 8.522 million barrels a day. Rising oil output is bearish for global oil market struggling to rebalance as supply outstrips slow growth in demand.
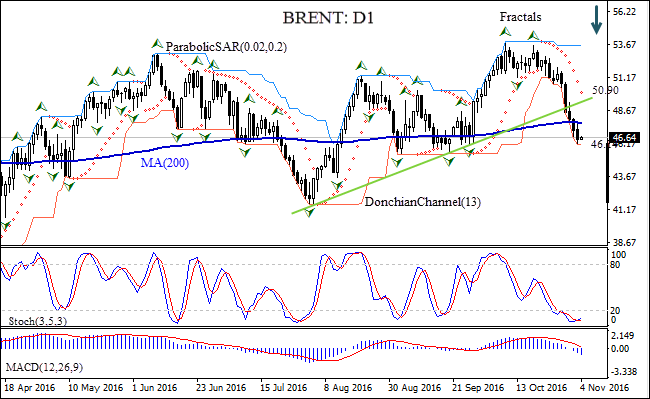
On the daily chart the BRENTD1 has been falling after hitting a one year high on October 10. The price has fallen below the support of the uptrend and the 200-day moving average MA(200).
- The Donchian channel is flat, indicating no trend yet.
- The Parabolic indicator gives a sell signal.
- The Stochastic oscillator is in the oversold zone and rising, this is a bullish signal.
- The MACD indicator gives a bearish signal.
We expect the bearish momentum will continue after the price breaches below lower Donchian bound at 46.14. This level can be used as an entry point for a pending order to sell. The stop loss can be placed above the Parabolic signal at 50.90. After placing the pending order, the stop loss is to be moved to the next fractal low, following Parabolic signals. By doing so, we are changing the probable profit/loss ratio to the breakeven point. The most risk-averse traders may switch to the 4-hour chart after the trade and place there a stop-loss moving it in the direction of the trade. If the price meets the stop loss level (50.90) without reaching the order (46.14), we recommend canceling the position: the market sustains internal changes which were not taken into account.
Summary of technical analysis:
| Position | Sell |
| Sell stop | below 46.14 |
| Stop loss | above 50.90 |