
Strong economic data bullish for Australian dollar
Australian economic data were strong recently. Will the <a href="https://www.ifcmarkets.com/en/trading-conditions/forex/audusd
?utm_source=financemagnates&utm_medium=Profile_listing&utm_campaign=News">AUDUSD rebound?
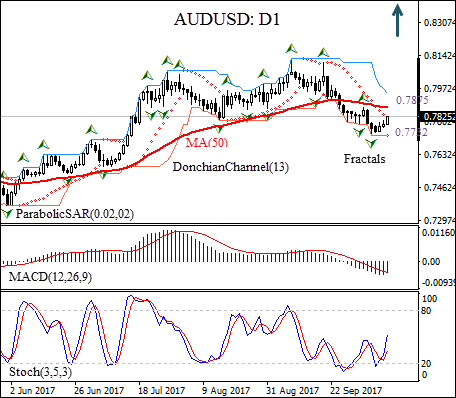
On the daily timeframe the AUDUSD: D1 is retracing higher after decline following the seventeen-month high in the beginning of September. The price has fallen below the 50-day moving average MA(50).
- The Donchian channel indicates downtrend: it is tilted down.
- The MACD indicator is below the signal line and the gap is narrowing, which is a bullish signal.
- The Parabolic indicator gives a buy signal.
- The stochastic oscillator is rising but hasn’t reached the overbought zone.
We believe the bullish momentum will continue after the price closes above the MA(50)and the fractal high at 0.7875. This level can be used as an entry point for placing a pending order to buy. The stop loss can be placed below the fractal low at 0.7732. After placing the order, the stop loss is to be moved every day to the next fractal low, following Parabolic signals. Thus, we are changing the probable profit/loss ratio to the breakeven point. If the price meets the stop loss level (0.7732) without reaching the order (0.7875), we recommend cancelling the position: the market has undergone internal changes which were not taken into account.
Summary of technical analysis:
| Position | Buy |
| Buy stop | Above 0.7875 |
| Stop loss | Below 0.7732 |