
Improving global growth supports Australian stock index
The Reserve Bank of Australia refrained from cutting the official cash rate at its June policy meeting. The International Monetary Fund upgraded China’s 2017 growth prospect. Will the Australia 200 stock index continued rising as global growth prospects improve?
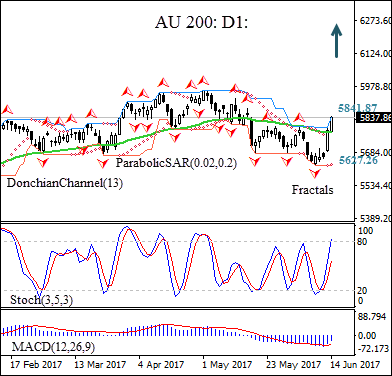
On the daily timeframe AU200: D1 is rebounding after hitting four-month low in the beginning of June. The price has closed above the 50-day moving average MA(50).
- The Donchian channel indicates an uptrend: it is tilted upward.
- The Parabolic indicator has formed a buy signal.
- The MACD indicator is below the signal line and the gap is narrowing, which is a bullish signal.
- The stochastic oscillator has breached into the overbought zone, which is a bearish signal.
We believe the bullish momentum will continue after the price closes above the upper boundary of Donchian channel at 5841.87. This level can be used as an entry point for placing a pending order to buy. The stop loss can be placed below the Parabolic signal at 5627.26, confirmed also by a fractal low. After placing the order, the stop loss is to be moved every day to the next fractal low, following Parabolic signals. Thus, we are changing the probable profit/loss ratio to the breakeven point. If the price meets the stop loss level (5627.26) without reaching the order (5841.87), we recommend cancelling the position: the market has undergone internal changes which were not taken into account.
Summary of technical analysis:
| Position | Buy |
| Buy stop | Above 5841.87 |
| Stop loss | Below 5627.26 |