

Global markets moved between geopolitical risk, the AI investment boom, and shifting monetary policy during the first half of 2026.
The U.S.–Iran conflict sent oil prices and inflation expectations sharply higher in late February. Global equities briefly lost about USD 9 trillion in market value. As tensions eased and AI demand returned, global equities recovered. Their total value ended around USD 7 trillion above year-end levels. The MSCI World Index gained nearly 10%.
Performance varied widely across assets. Oil surged before giving back most of its war premium. Precious metals fell sharply from record highs. Korean, Japanese, and U.S. technology stocks led global equities. China’s A-share market remained resilient, while Hong Kong stocks stayed under pressure.
The dollar strengthened again. U.S. and Chinese government bonds followed very different rate paths. Based on market performance through June 30, ETO Markets reviews the first half across commodities, equities, bonds, and currencies.
Oil: War Premium Surges, Then Collapses 38%
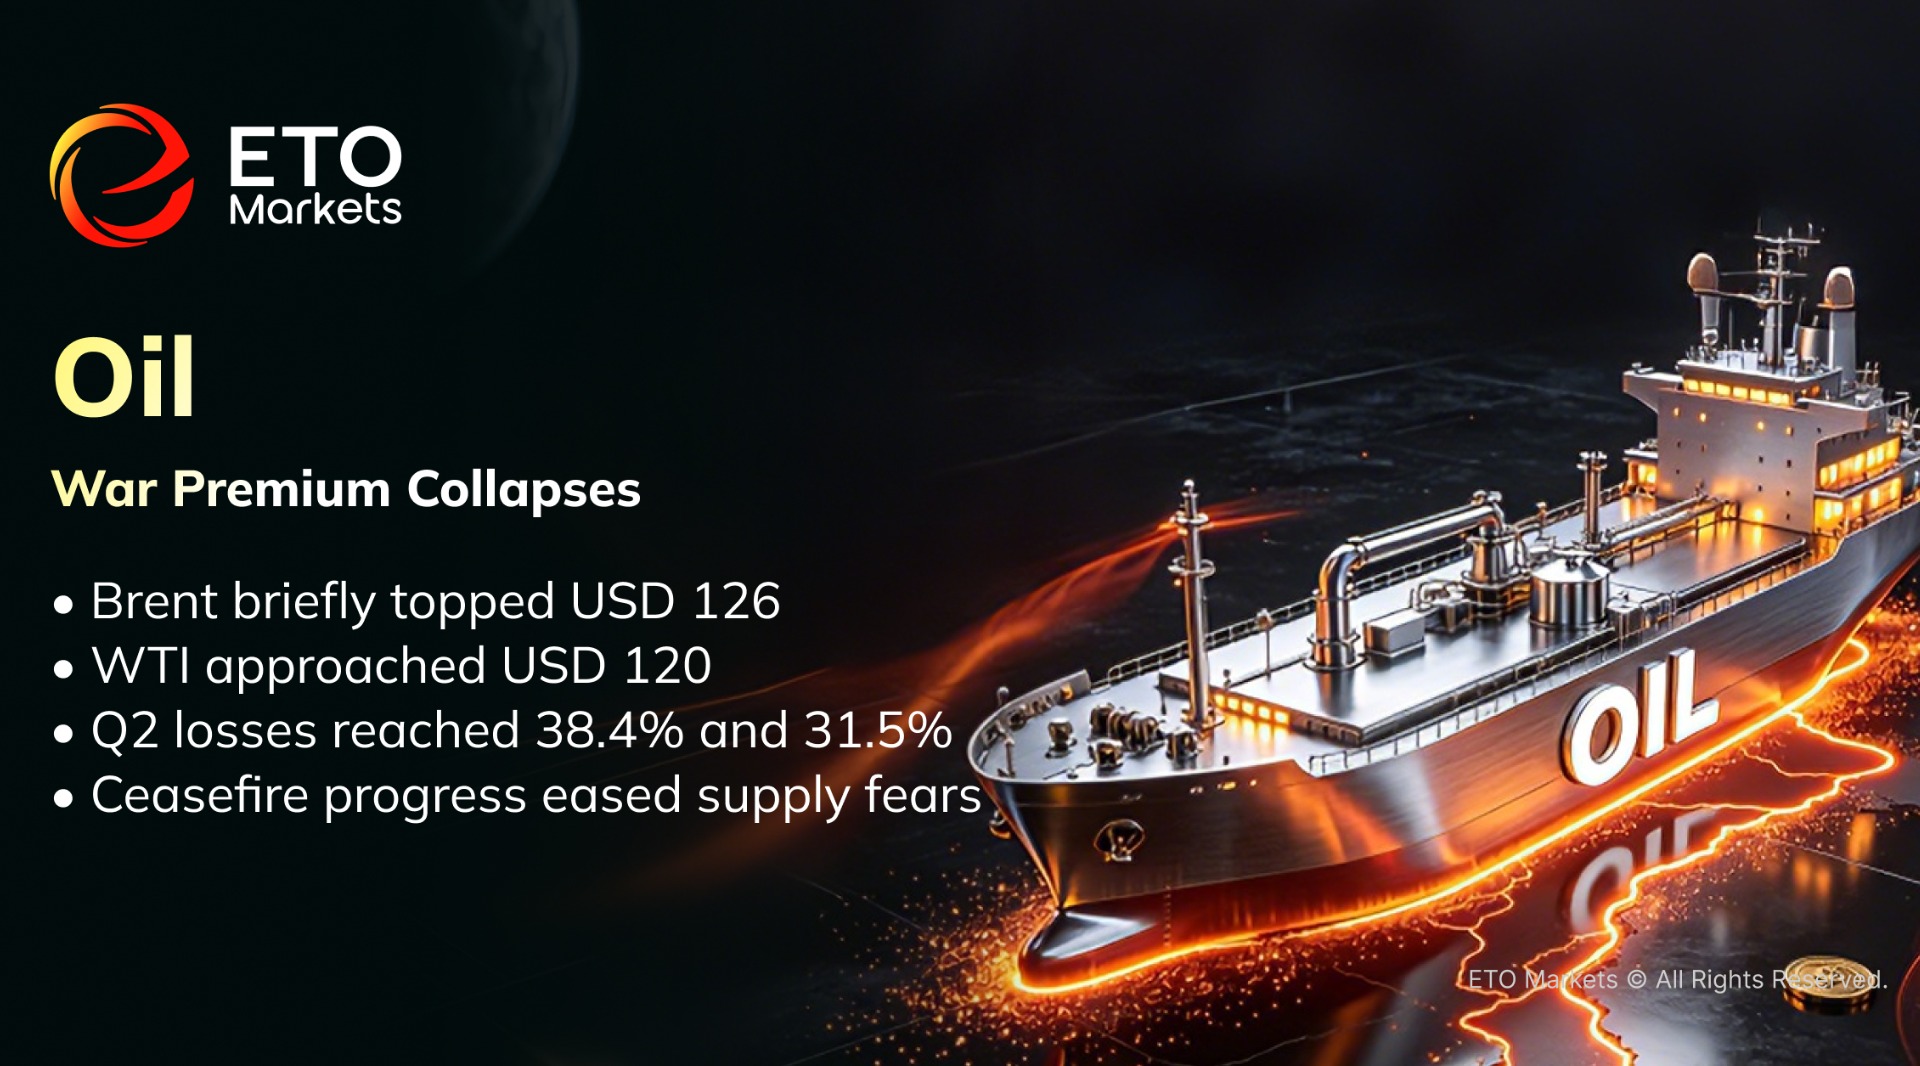
Oil was the most volatile major asset in the first half.
The U.S.–Iran conflict disrupted shipping through the Strait of Hormuz. Brent crude rose above USD 126 per barrel, while WTI approached USD 120. Prices fell quickly after ceasefire talks advanced and tanker traffic resumed. Brent ended June near USD 72.92 per barrel. WTI fell to around USD 69.50. Brent dropped 38.4% in the second quarter. WTI lost 31.5%. Strong first-quarter gains still kept both benchmarks positive for the first half.
Oil prices will now depend on shipping conditions, Iran’s export recovery, and OPEC+ supply policy. The extreme war premium has faded, but supply risks remain higher than before the conflict.
Gold and Silver: Higher Rates Hit Metals Hard
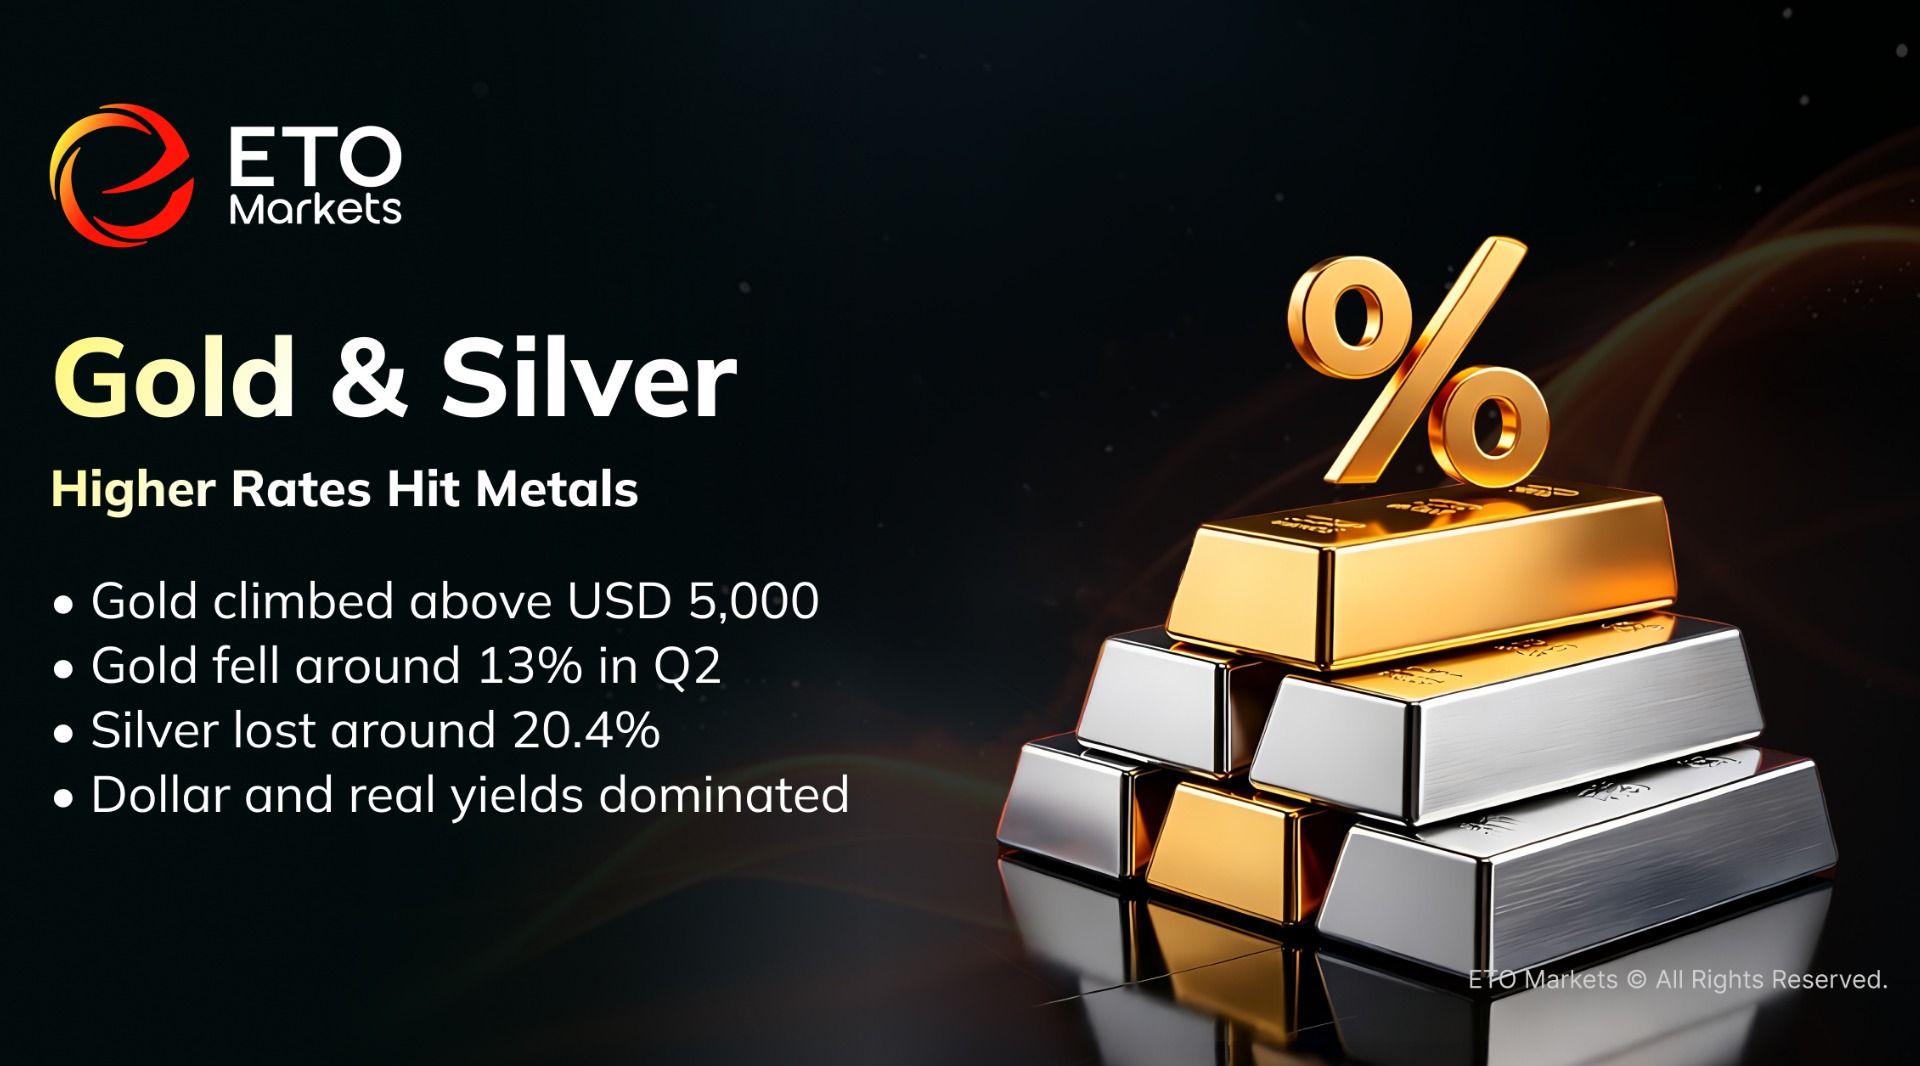
Gold extended its previous rally early in the year and moved above USD 5,000 per ounce. The conflict then pushed oil and inflation expectations higher. Markets moved away from FED rate-cut expectations and began pricing higher rates for longer, with some investors even considering renewed rate hikes. The dollar and real yields rose together. Gold fell about 11.2% in June and around 13% in the second quarter. It was the metal’s worst quarter since 2013.
Gold ended June near USD 4,027 per ounce and lost about 5% in the first half. Central bank buying and reserve diversification remain long-term supports. In the near term, gold will stay sensitive to the dollar, real yields, and FED policy. Silver suffered a deeper correction due to its higher volatility and stronger leverage to market liquidity. Silver fell about 20.4% in the second quarter. It ended June near USD 59.48 per ounce and lost around 16% during the first half.
Demand from solar energy, electronics, and electrification may provide support. A stronger recovery will still require easier liquidity conditions.
U.S. Stocks: AI Drives Double-Digit Gains
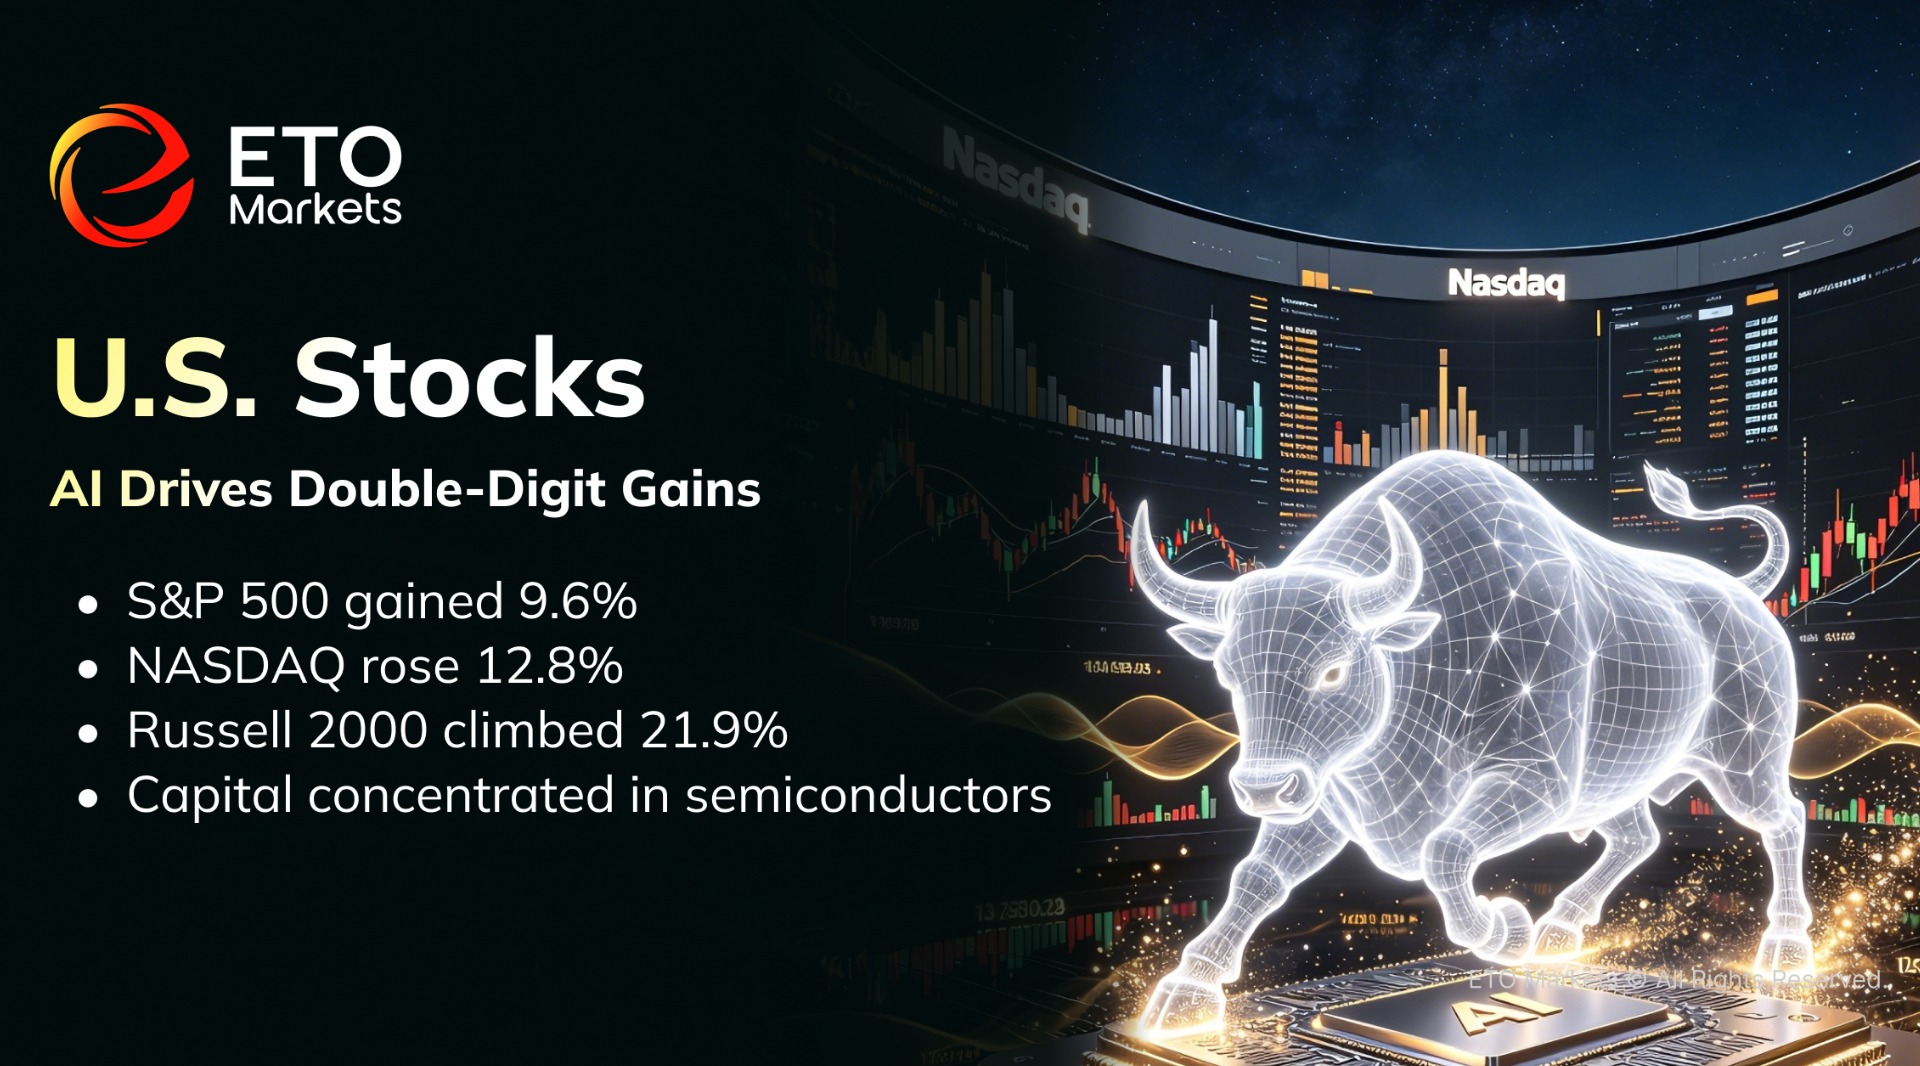
U.S. equities ended the first half higher. The S&P 500 gained 9.6%. The NASDAQ rose 12.8%, while the Dow Jones Industrial Average added 8.9%. The Russell 2000 climbed 21.9%. AI capital spending and semiconductor stocks remained the main drivers.
The S&P 500 rose 14.9% in the second quarter. The NASDAQ gained 21.4%. Both recorded their strongest quarter since 2020. However, the Magnificent Seven underperformed the global index as a group. Capital became more concentrated in semiconductors, AI infrastructure, and companies with clearer earnings growth.
The next phase will depend on whether AI investment produces sustained revenue and profit growth.
Asian Stocks: Korea Nearly Doubles, Hong Kong Slides
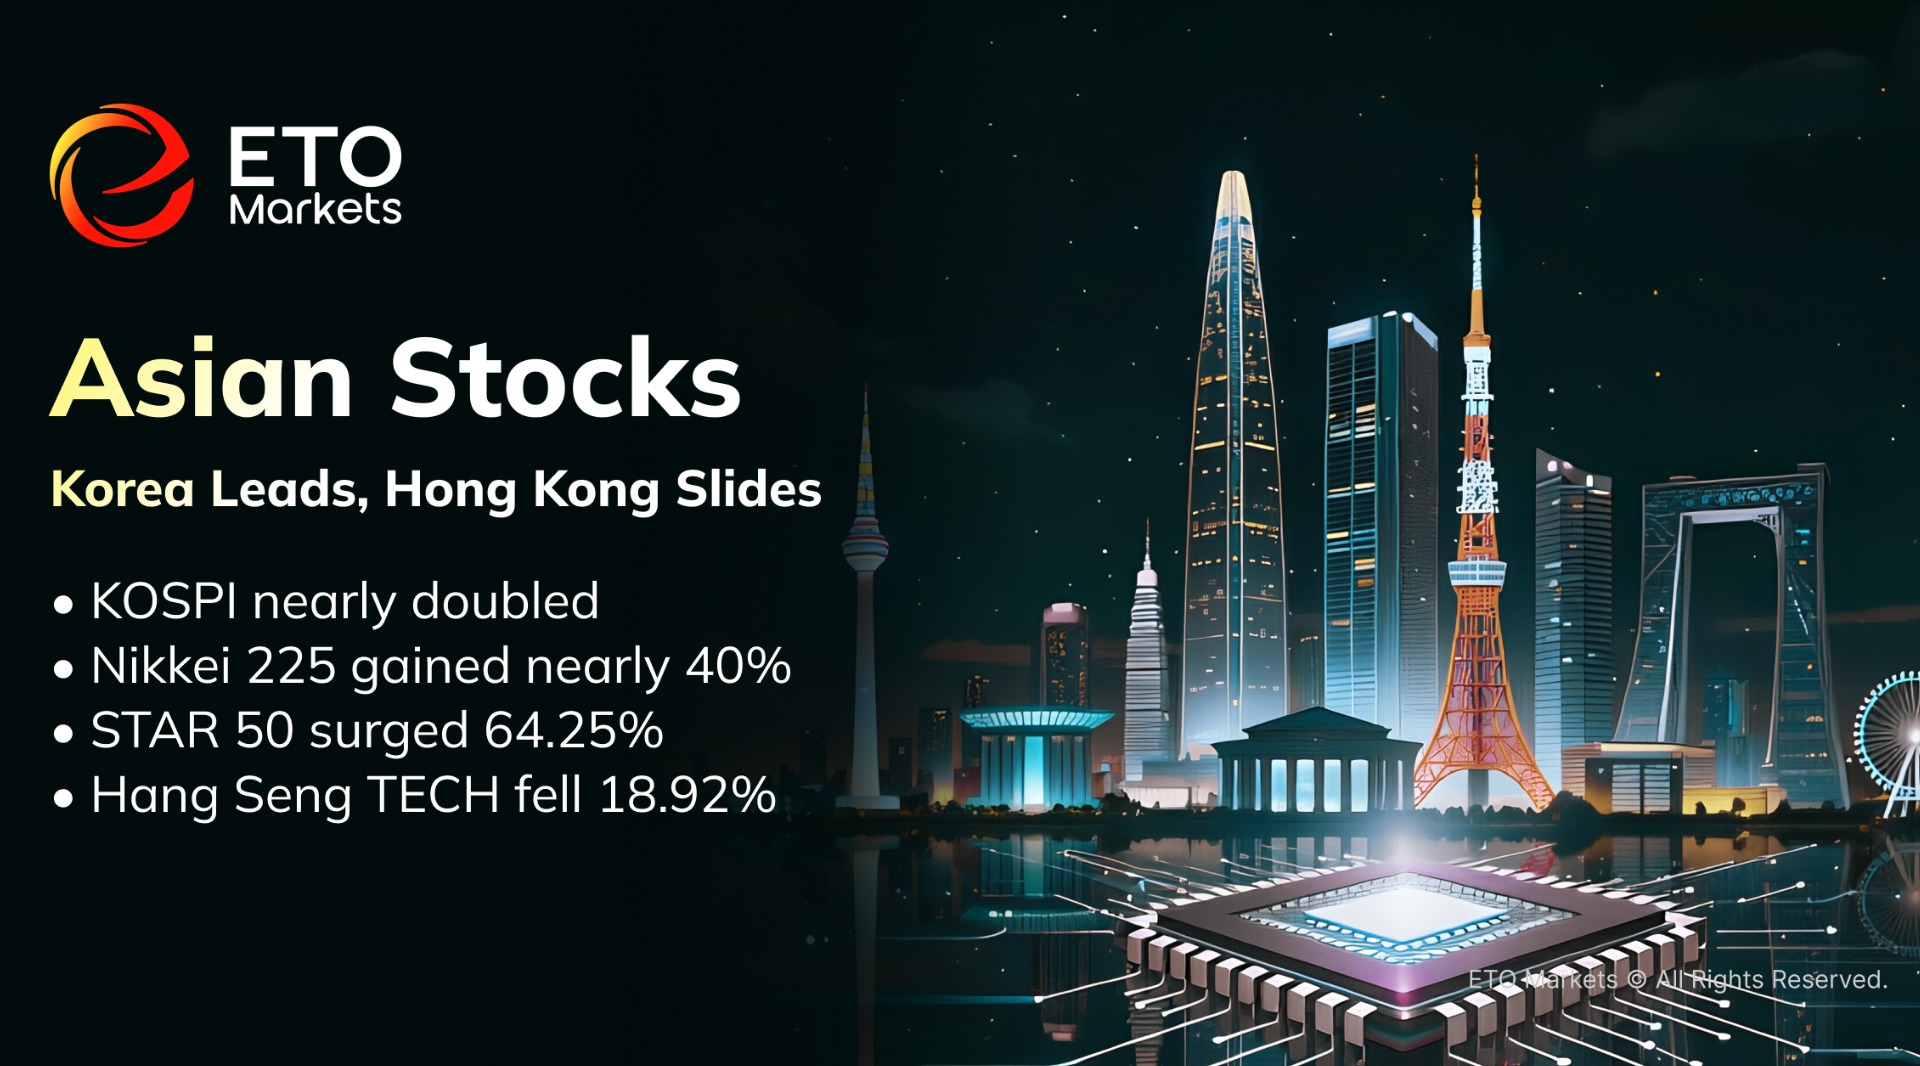
Asian equities showed extreme divergence during the first half. South Korea’s KOSPI nearly doubled. Samsung Electronics and SK Hynix benefited from strong demand for high-bandwidth memory, AI servers, and rising memory prices.
South Korea became one of the world’s strongest major markets. Its heavy exposure to semiconductors also raised its sensitivity to the memory cycle and global technology spending. Japan’s Nikkei 225 gained nearly 40% in the first half. It rose 37% in the second quarter alone.
Semiconductor equipment, electronic components, and exporters led the rally. A yen near a 40-year low also increased the value of overseas earnings. Currency intervention and higher Japanese rates may create more volatility later in the year.
China’s A-share market delivered a clear hard-technology rally. The STAR 50 Index rose 64.25%, while the ChiNext Index gained 35.58%.
AI computing, semiconductors, robotics, and advanced manufacturing led the market. Consumer, financial, and property stocks remained weak. Major indexes rose even as many individual stocks declined.
Hong Kong lagged. The Hang Seng Index fell 10.73%, while the Hang Seng TECH Index lost 18.92%. Lower earnings forecasts for internet, automotive, and consumer companies weighed on the market. A stronger dollar and higher U.S. Treasury yields also raised funding costs in the offshore market.
The second-half outlook depends on global AI spending, the memory cycle, Japanese currency policy, the dollar, and liquidity conditions in China.
U.S. Treasuries: Rate Cuts Fade, Yields Climb
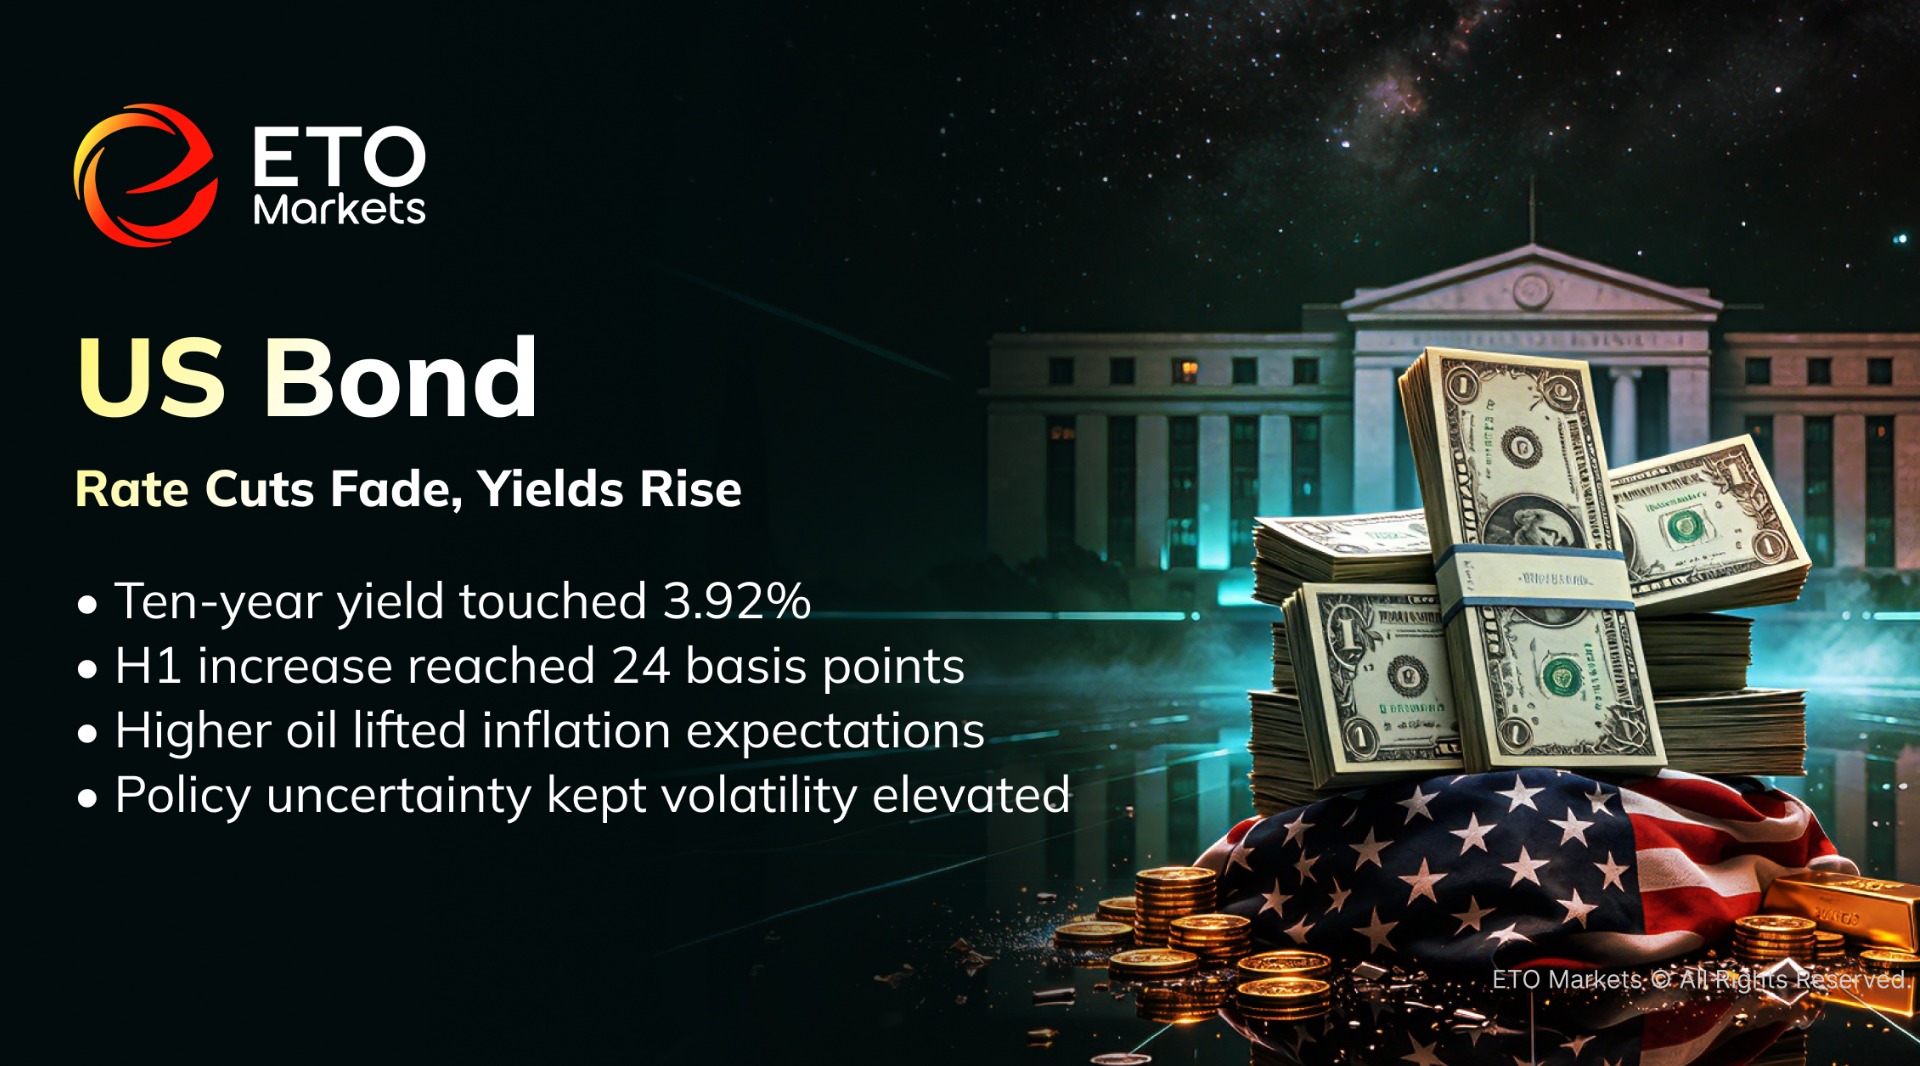
Markets began the year expecting two or three FED rate cuts.
The 10-year U.S. Treasury yield briefly fell to 3.92%. Rising oil prices then lifted inflation expectations and weakened the rate-cut case. The 10-year yield rose about 24 basis points during the first half.
Several medium and long-duration Treasury funds posted losses. Investors now disagree on whether the FED will raise rates, hold policy steady, or return to cuts. This uncertainty may keep Treasury volatility high.
Dollar Index: Safe-Haven Demand Pushes DXY Higher
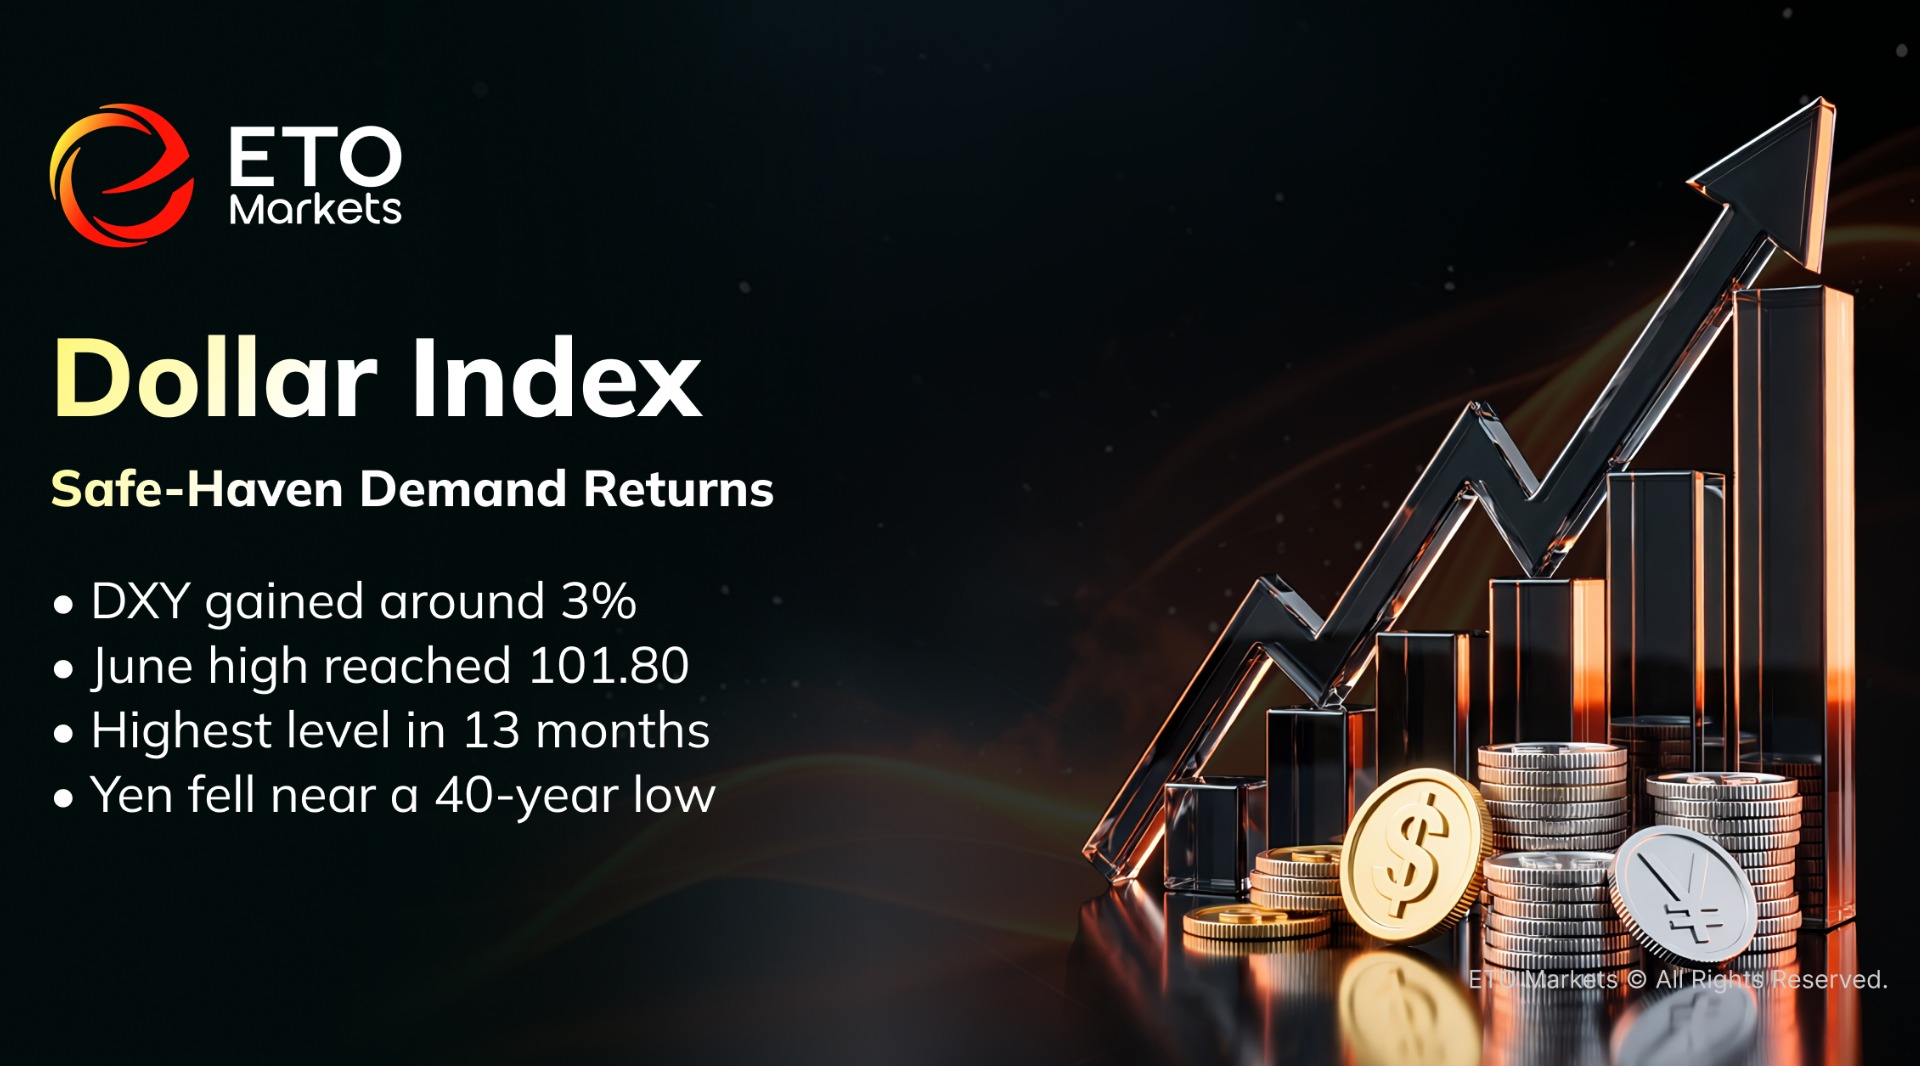
The U.S. Dollar Index recovered after its sharp decline in 2025.
DXY gained about 3% in the first half. It reached 101.80 in June, its highest level in 13 months. Rate-hike expectations, demand for U.S. assets, and geopolitical risk supported the dollar.
The yen fell to its weakest level in around 40 years. The dollar’s next move will depend on inflation and actual FED action. A sustained oil-driven inflation rebound would support further strength.
Cryptocurrencies: Liquidity Retreat Erases Post-Election Gains
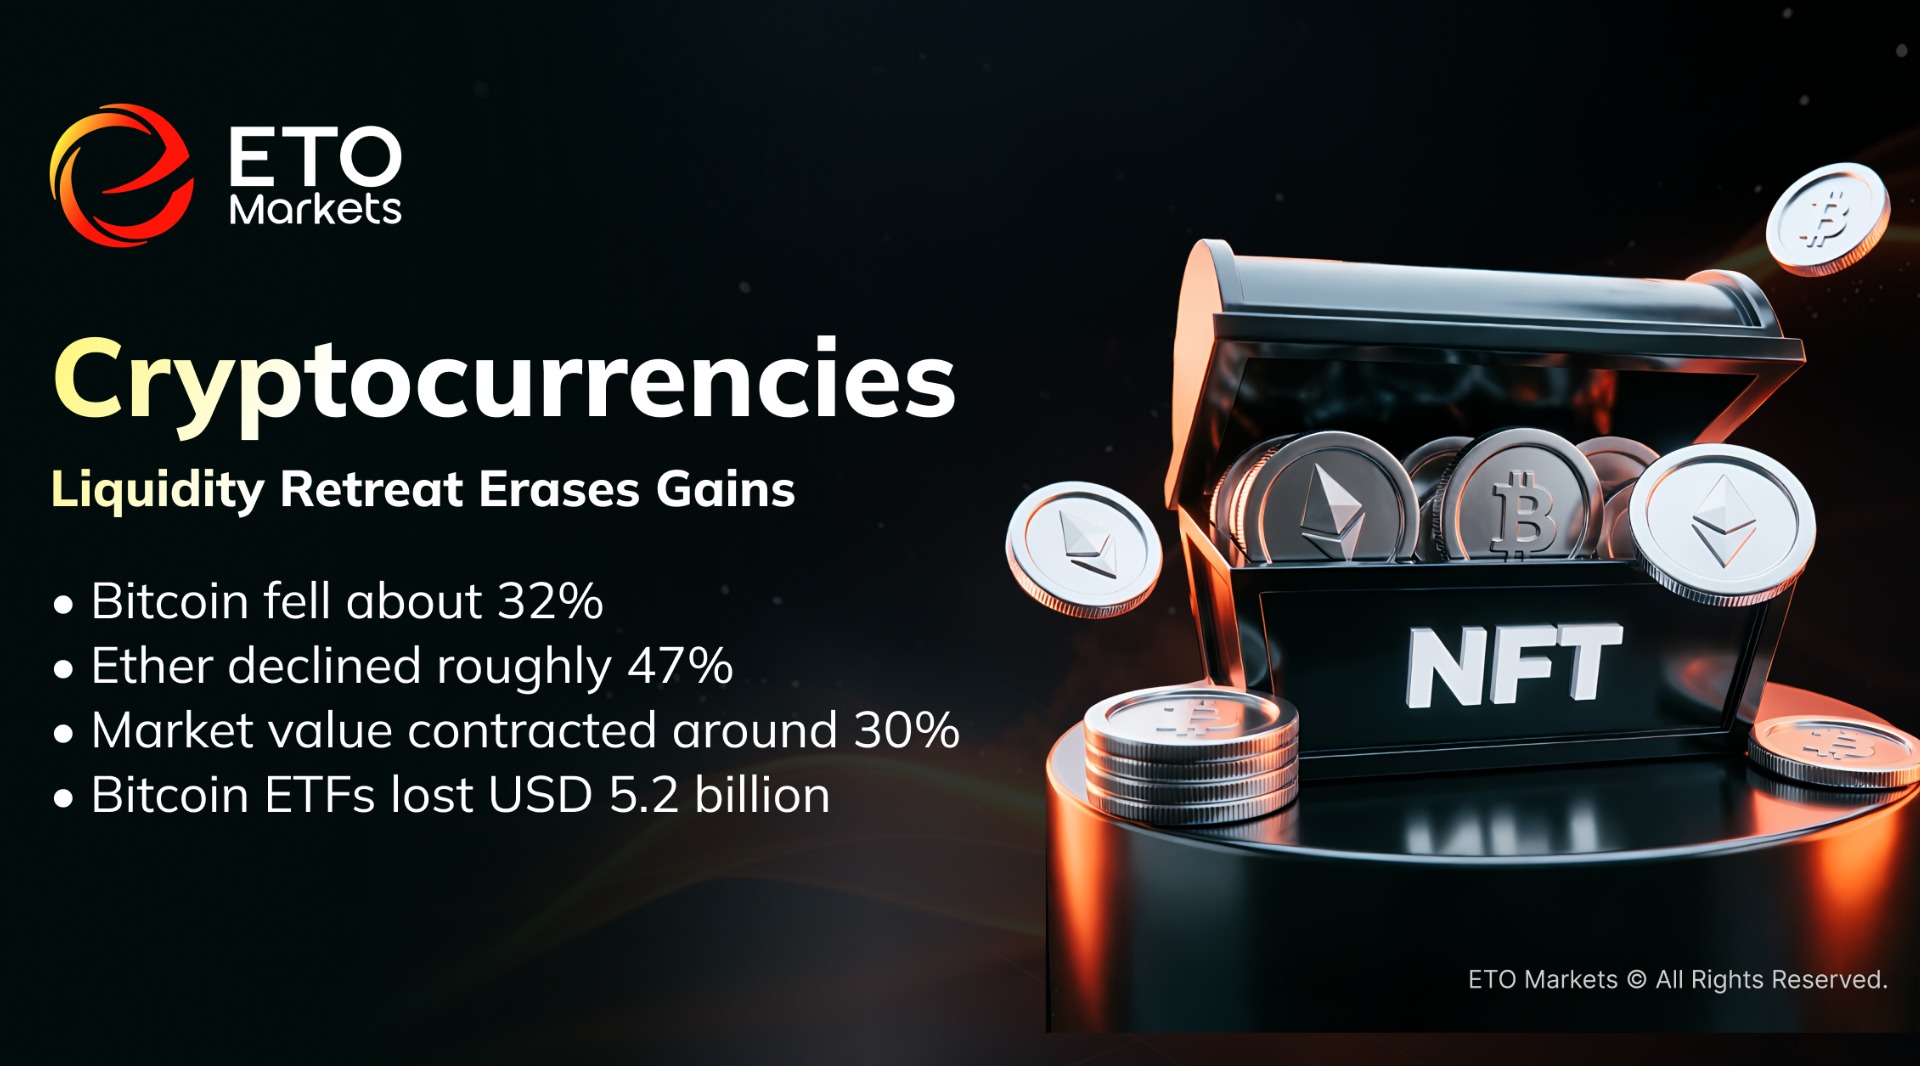
Crypto assets ranked among the weakest-performing major asset classes in the first half of 2026.
Bitcoin fell about 32%, ending June near USD 59,000, while Ether declined roughly 47%. Shares of Strategy, the largest corporate holder of Bitcoin, dropped more than 40%. Total crypto market capitalisation contracted by around 30% to nearly USD 2 trillion, largely erasing the gains accumulated since the November 2024 US presidential election.
A more hawkish Federal Reserve outlook, persistent outflows from spot Bitcoin ETFs and a shift in capital toward AI and semiconductor assets collectively weakened risk appetite.
Second Half: FED Policy Will Decide Winners
The first half was not a simple risk-on or risk-off market. It was a broad repricing of AI, war risk, inflation, and liquidity. AI supported global technology assets. Geopolitical tension increased commodity volatility. A stronger dollar and higher rates pressured precious metals, Hong Kong equities, and U.S. Treasuries. Chinese government bonds and the renminbi showed greater stability.
FED policy remains the most important variable for the second half.Lower oil prices could reduce inflation pressure and weaken rate-hike expectations. This would support gold, U.S. Treasuries, and Hong Kong equities. Persistent inflation and higher rates would favour the dollar and short-duration assets. AI capital spending will also remain critical. It will decide whether rallies in U.S. technology stocks, South Korean equities, and global semiconductors can continue.
ETO Markets will continue tracking FED policy, energy supply, AI investment, and global capital flows. Our cross-asset framework helps investors identify market rotation and manage concentration risk in volatile conditions.
About Us
ETO Markets is a global financial services provider headquartered in Australia, serving traders in over 120 countries worldwide. Designed for those who value speed, transparency, and capital security, ETO Markets blends advanced trading technology with access to a diverse range of asset classes, including forex, precious metal, energies, indices, stocks, cryptocurrency.
Disclaimer
The information contained herein is for general reference only and does not constitute investment advice, a solicitation, or an offer to buy or sell any financial products. ETO Markets does not guarantee the accuracy, completeness, or timeliness of the information and shall not be liable for any losses incurred from reliance on such content.