
Norway economy lags behind in growth
The Norway economic indicators look weaker than those in Europe and the US. Will the Norwegian krone weaken?
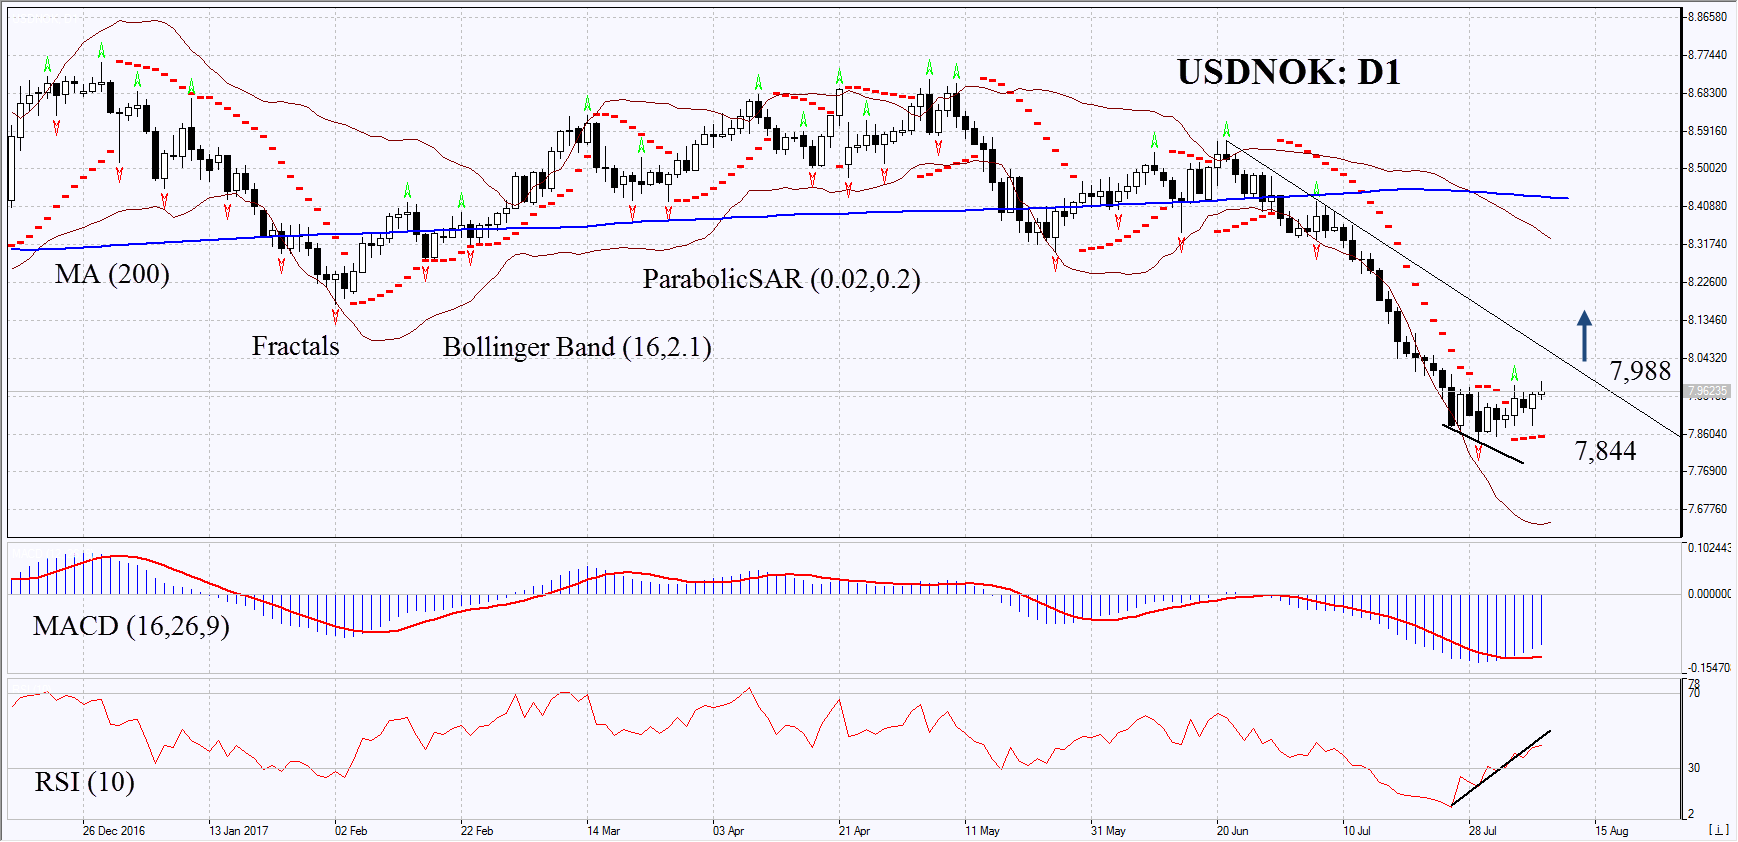
On the daily timeframe, USDNOK: D1 remains in the downtrend. However, its decline has slowed down and a number of technical analysis indicators have formed bullish signals. The further price growth is possible in case of the worsening of the Norwegian economic conditions and good economic data in the US.
- The Parabolic indicator gives a bullish signal.
- The Bollinger bands have markedly widened, which means high volatility.
- The RSI Indicator reached the oversold zone and started to grow. It is below 50 and has formed a positive divergence.
- The MACD Indicator gives a bullish signal.
The bullish momentum may develop in case USDNOK exceeds the Wednesday high at 7.988. This level may serve as an entry point. The initial stop loss may be placed below the last fractal low, the 2-year low and the Parabolic signal at 7.844. After opening the pending order, we shall move the stop to the next fractal low following the Bollinger and Parabolic signals. Thus, we are changing the potential profit/loss to the breakeven point. More risk-averse traders may switch to the 4-hour chart after the trade and place there a stop loss moving it in the direction of the trade. If the price meets the stop level at 7.844 without reaching the order at 7.988 we recommend cancelling the position: the market sustains internal changes that were not taken into account.
Summary of technical analysis:
| Position | Buy |
| Buy stop | above 7,988 |
| Stop loss | below 7,844 |