
Improving data support USDIDX
Improving US economic data support US dollar. Will the USDIDX continue advancing?
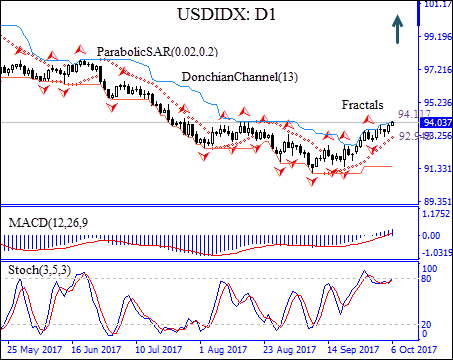
On the daily timeframe the USDIDX: D1 has been rising after hitting 46-month low in the beginning of September.
- The Donchian channelindicates uptrend: it is tilting upward.
- The MACD indicator gives a bullish signal: it is above the signal line and the gap is widening.
- The Parabolic indicator gives a buy signal.
- The stochastic oscillator is falling but has not reached oversold zone yet.
We expect the bullish momentum will continue after the price breaches above the upper Donchian bound at 94.107. A price above this level can be used as an entry point for a pending order to buy. The stop loss can be placed below the fractal low at 92.943. After placing the pending order, the stop loss is to be moved to the next fractal low, following Parabolic signals. By doing so, we are changing the probable profit/loss ratio to the breakeven point. If the price meets the stop loss level (92.943) without reaching the order, we recommend canceling the position: the market sustains internal changes which were not taken into account.
Summary of technical analysis:
| Position | Buy |
| Buy stop | Above 94.117 |
| Stop loss | Below 92.943 |