
Inflation in the Czech Republic has reached its highest level since November 2012
Inflation in the Czech Republic amounted to 2.5% year-over-year in July 2017 reaching the Czech National Bank (CNB) target level of 2% with a range of plus or minus 1%. Will the correction of the Czech koruna continue?
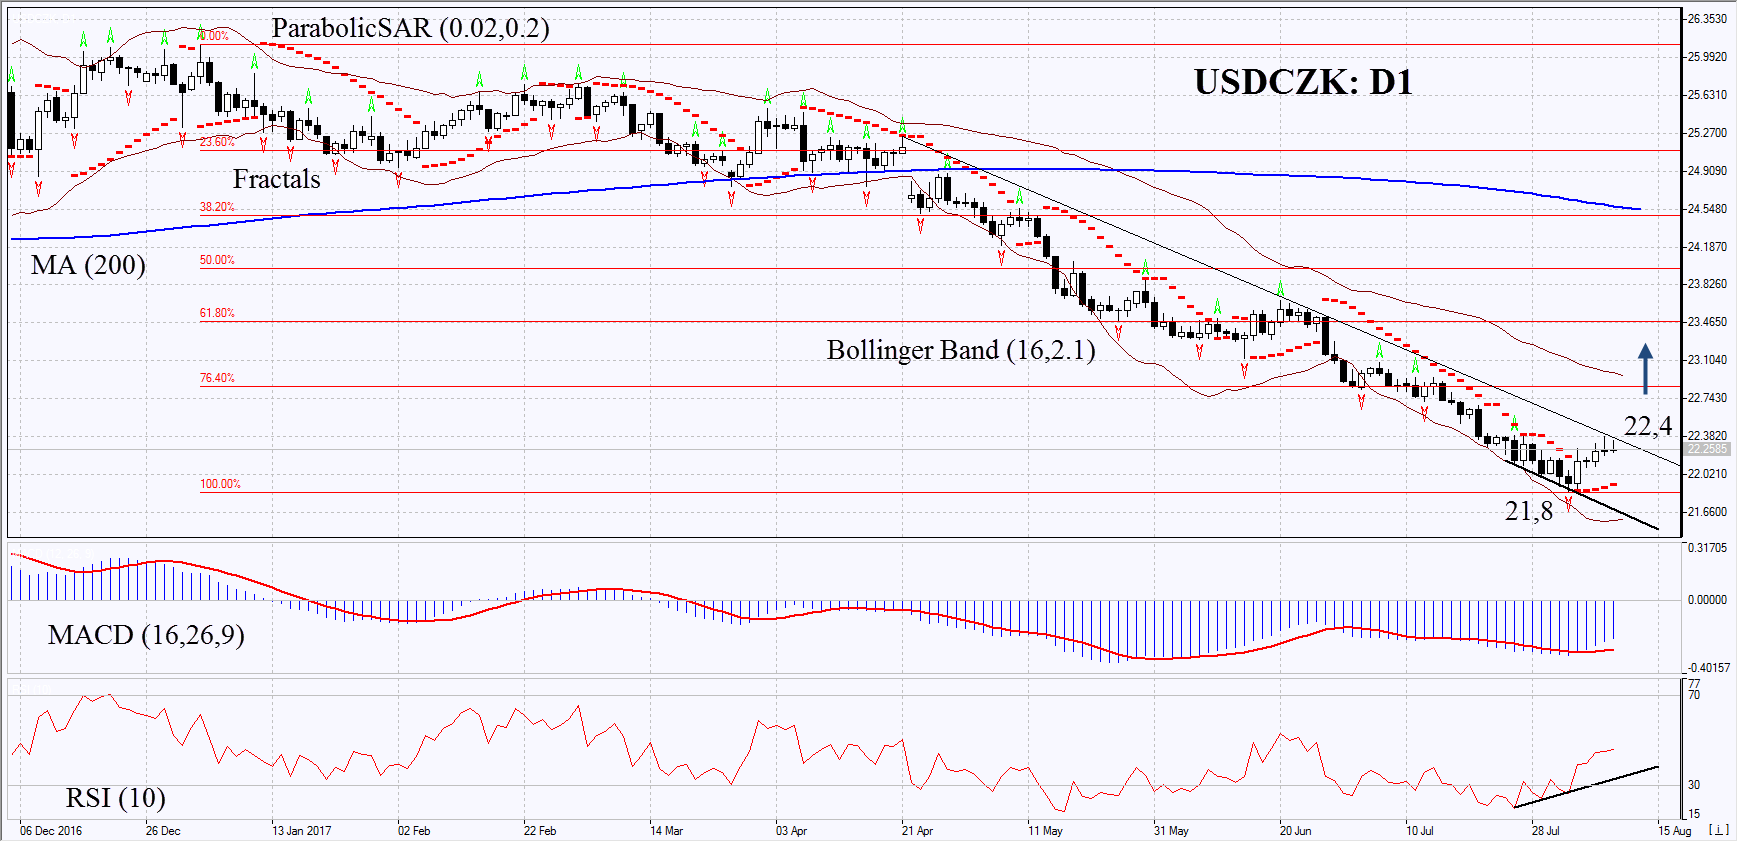
On the daily timeframe, USDCZK: D1 remains in a downtrend. However, its decline has slowed down and a number of technical analysis indicators have formed bullish signals. The further price growth is possible in case of the worsening of the Czech economic conditions and positive economic data in the US.
- The Parabolic indicator gives a bullish signal.
- The Bollinger bands have markedly widened, which means high volatility.
- The RSI Indicator reached the oversold zone and started to grow. It is below 50 and has formed a positive divergence.
- The MACD Indicator gives a bullish signal.
The bullish momentum may develop in case USDCZK exceeds the last fractal high and the resistance line of a downtrend at 22.4. This level may serve as an entry point. The initial stop loss may be placed below the last fractal low, the 2.5-year low and the Parabolic signal at 21.8. After opening the pending order, we shall move the stop to the next fractal low following the Bollinger and Parabolic signals. Thus, we are changing the potential profit/loss to the breakeven point. More risk-averse traders may switch to the 4-hour chart after the trade and place there a stop loss moving it in the direction of the trade. If the price meets the stop level at 21.8 without reaching the order at 22.4 we recommend cancelling the position: the market sustains internal changes that were not taken into account.
Summary of technical analysis:
| Position | Buy |
| Buy stop | above 22,4 |
| Stop loss | below 21,8 |