
Slower growth outlook bearish for Swiss franc
Swiss economic growth outlook was downgraded due to weak performance in the first half of the year. Will the USDCHF continue rebounding?
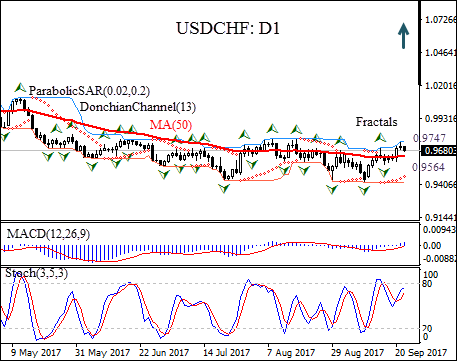
The USDCHF is rising on the daily chart after hitting twelve month low two weeks ago.
- The Donchian channel signals uptrend: it is tilted up.
- The MACD indicator is above the signal and the gap is widening, which is a bullish signal.
- The Parabolic indicator gives a buy signal.
- The stochastic oscillator is rising, but hasn’t reached the overbought zone.
We believe the bullish momentum will continue after the price breaches above the upper Donchian bound at 0.9747. This level can be used as an entry point for a pending order to buy. The stop loss can be placed below the fractal low at 0.9564. After placing the order, the stop loss is to be moved every day to the next fractal low, following Parabolic signals. Thus, we are changing the probable profit/loss ratio to the breakeven point. If the price meets the stop loss level without reaching the order, we recommend cancelling the position: the market sustains internal changes which were not taken into account.
Summary of technical analysis:
| Position | Buy |
| Buy stop | Above 0.9747 |
| Stop loss | Below 0.9564 |