
Improving growth bullish for UK market
UK manufacturing production and GDP accelerated recently. Will the GB 100 index advance?
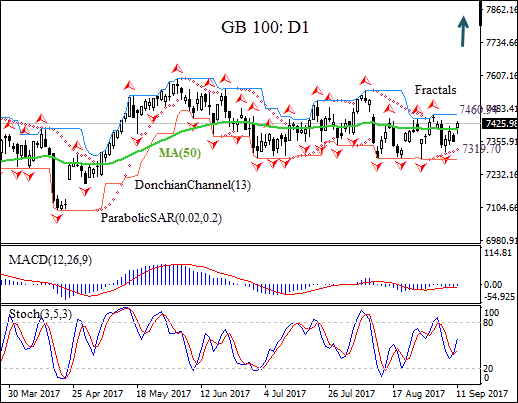
On the daily chart GB100: D1 has closed above the 50-day moving average MA(50).
- The Donchian channel indicates no trend yet: it is flat.
- The MACD indicator is below the signal line with the gap narrowing. This is a bullish signal.
- The Parabolic indicator has formed a buy signal.
- The stochastic oscillator is rising but hasn’t crossed into overbought zone yet.
We believe the bullish momentum will continue after the price breaches above the upper Donchian boundary at 7460.94, confirmed also by fractal high. The stop loss can be placed below the last fractal low at 7319.70. After placing the pending order the stop loss is to be moved every day to the next fractal low, following Parabolic signals. Thus, we are changing the probable profit/loss ratio to the breakeven point. If the price meets the stop-loss level (7319.70) without reaching the order (7460.94) we recommend cancelling the position: the market sustains internal changes which were not taken into account.
Summary of technical analysis:
| Position | Buy |
| Buy stop | Above 7460.94 |
| Stop loss | Below 7319.70 |