
Preparing for the publication of significant statistics
The preliminary UK GDP for Q2, 2017 increased by 1.7%. This is its minimum growth over the past 4 years. Will the FTSE 100 prices continue to decline?
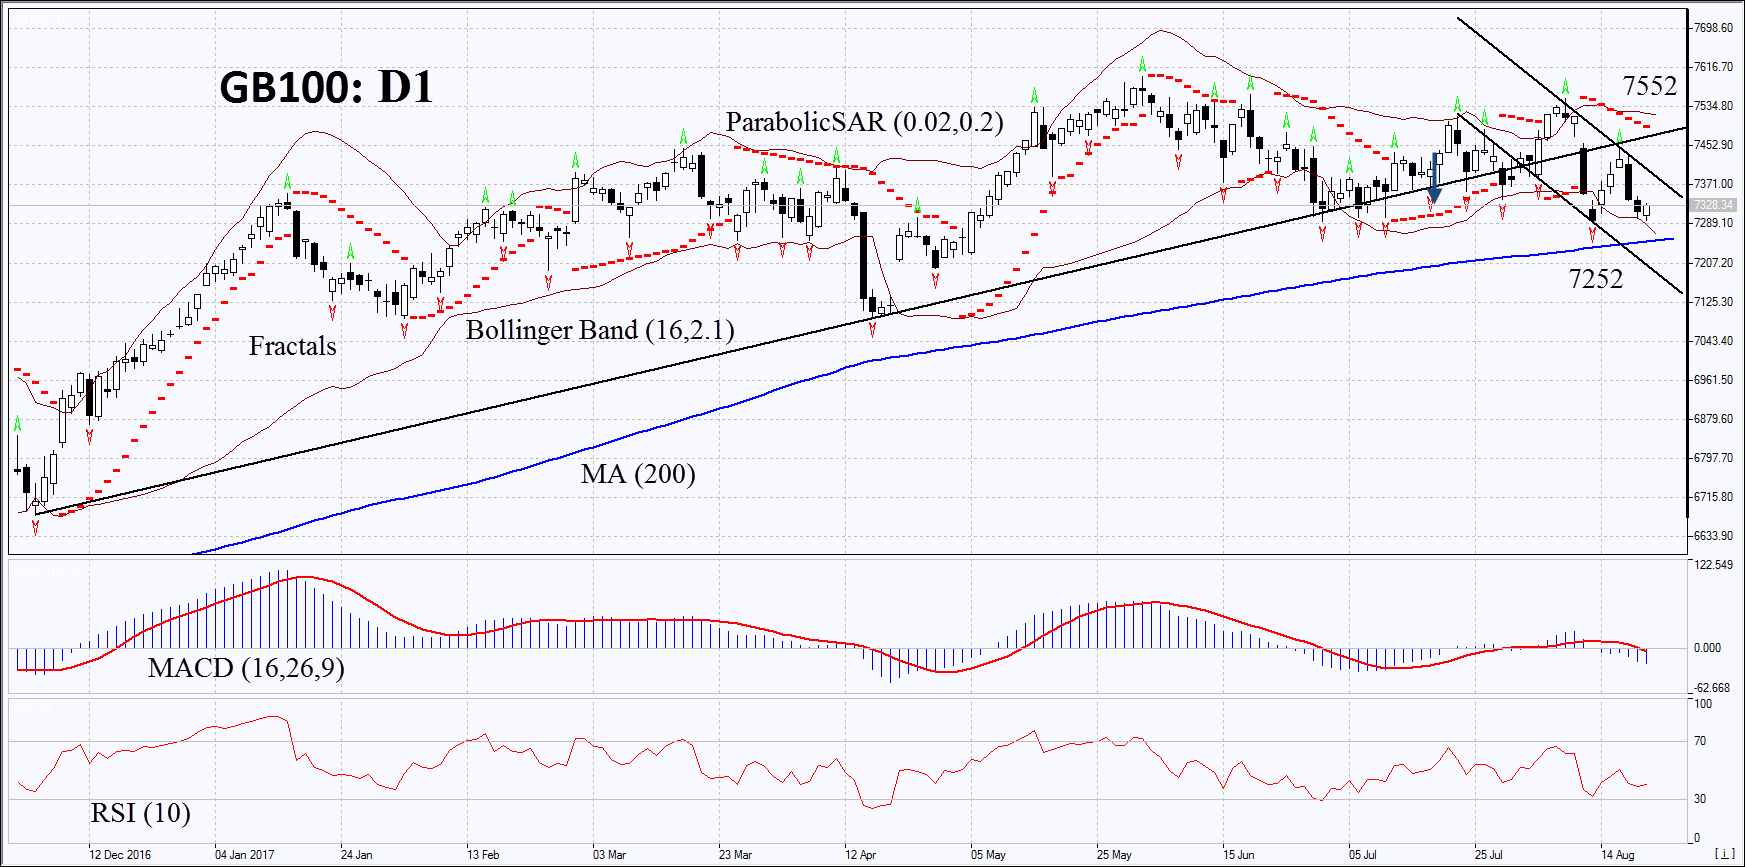
On the daily timeframe, GB100: D1 came out from the rising trend. The full downward correction is possible in case of the weak economic data in the UK, as well as the decrease of the world stock indices.
- The Parabolic indicator gives a bearish signal.
- The Bollinger bands are widening, which means higher volatility. They are tilted downwards.
- The RSI indicator is below 50. No divergence.
- The MACD indicator gives a bearish signal.
The bearish momentum may develop in case GB100 drops below the 200-day moving average line, the last fractal low and the lower Bollinger band at 7252. This level may serve as an entry point. The initial stop loss may be placed above the two fractal highs, the upper Bollinger band and the Parabolic signal at 7552. After opening the pending order, we shall move the stop to the next fractal high following the Bollinger and Parabolic signals. Thus, we are changing the potential profit/loss to the breakeven point. More risk-averse traders may switch to the 4-hour chart after the trade and place there a stop loss moving it in the direction of the trade. If the price meets the stop level at 7252 without reaching the order at 7552 we recommend cancelling the position: the market sustains internal changes that were not taken into account.
Summary of technical analysis:
| Position | Sell |
| Sell stop | Below 7252 |
| Stop loss | Above 7552 |