
Drought may damage the wheat crop
Drought in Australia and the Republic of South Africa may significantly reduce the cereal crops. Will the wheat prices increase?
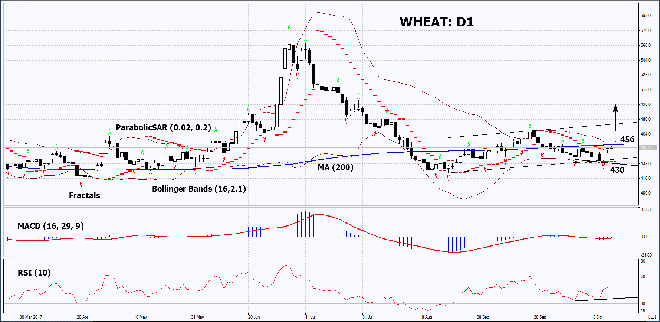
On the daily timeframe, WHEAT: D1 is in the rising channel. Further price increase is possible in case of preserving high global demand and the decrease of crop in major producer countries.
- The Parabolic indicator gives a bullish signal.
- The Bollinger bandshave narrowed, which means lower volatility. They are tilted upwards.
- The RSI Indicator exceeded 50. It has formed a positive divergence.
- The MACD Indicator gives a bullish signal.
The bullish momentum may develop in case WHEAT exceeds the 200-day moving average line, the last fractal high and the upper Bollinger band at 456. This level may serve as an entry point. The initial stop loss may be placed below the Parabolic signal, the lower Bollinger band, the 2-month low and last fractal low at 430. After opening the pending order, we shall move the stop to the next fractal low following the Bollinger and Parabolic signals. Thus, we are changing the potential profit/loss to the breakeven point. More risk-averse traders may switch to the 4-hour chart after the trade and place there a stop loss moving it in the direction of the trade. If the price meets the stop level at 430 without reaching the order at 456, we recommend cancelling the position: the market sustains internal changes that were not taken into account.
Summary of technical analysis:
| Position | Buy |
| Buy stop | above 456 |
| Stop loss | below 430 |