
Orange juice reserves reduced in the US
The US Department of Agriculture (USDA) reported a decrease in orange juice reserves. Will its prices grow?
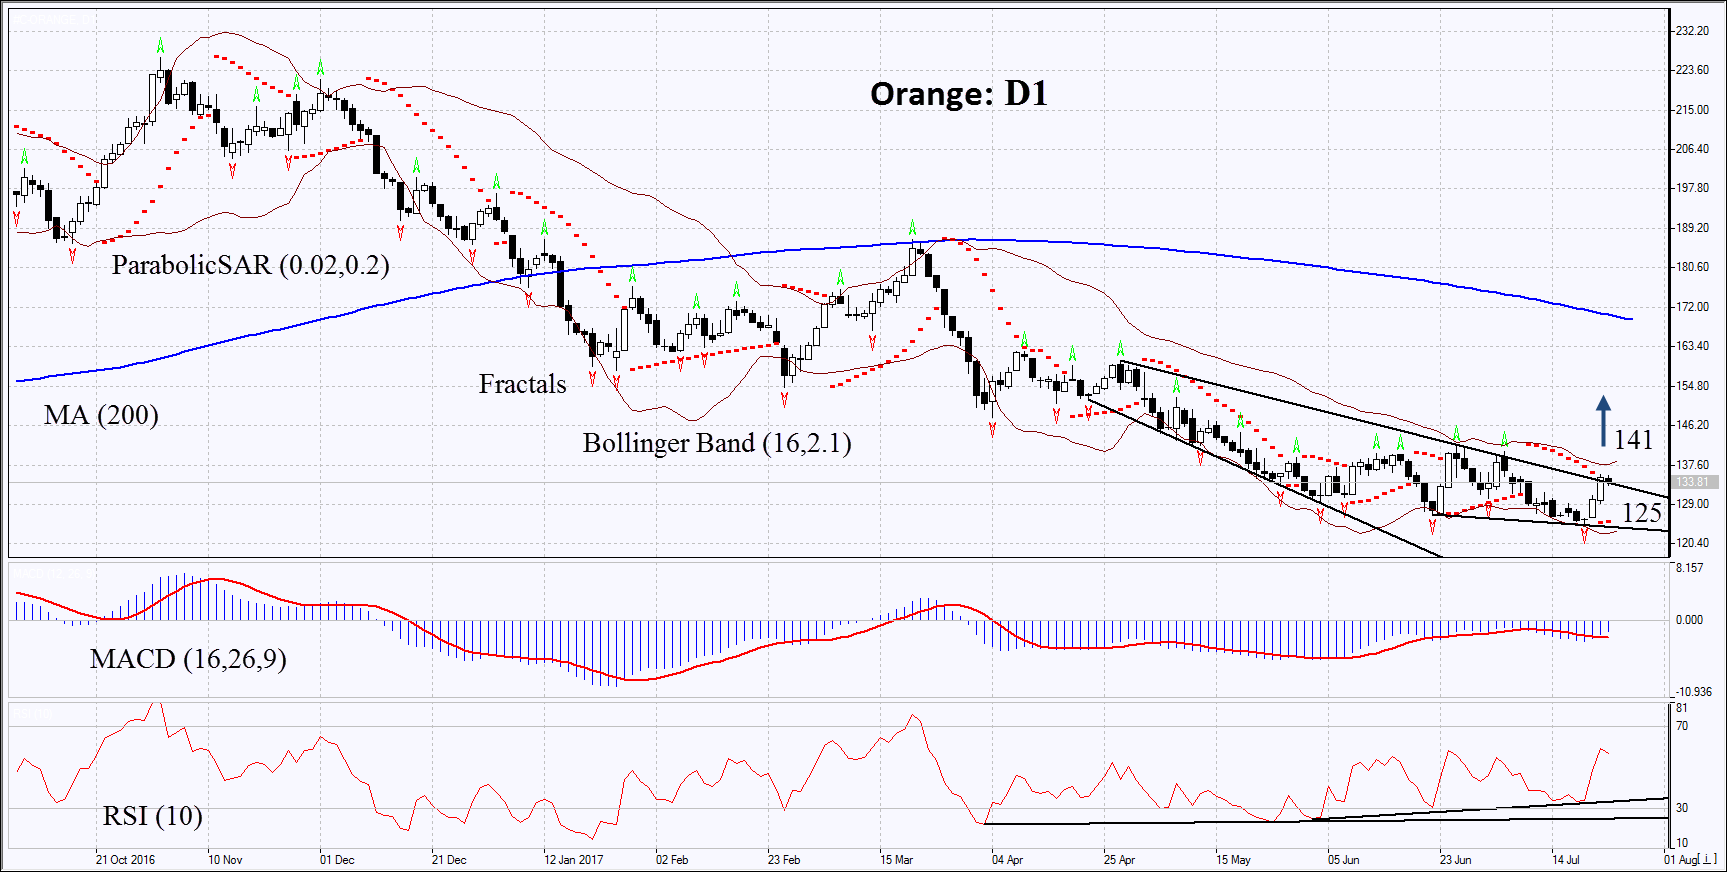
On the daily timeframe, ORANGE: D1approached the resistance line of a downtrend. To open a buy position, it needs to be overcome. The further price increase is possible in case of a further reduction of the orange juice reserves in the US and citrus fruits crops in Brazil.
- The Parabolic indicator gives a bullish signal.
- The Bollinger bands have narrowed, which means lower volatility. They are tilted upwards.
- The RSI Indicator is above 50. It has formed a positive divergence.
- The MACD Indicator indicator gives a bullish signal.
The bullish momentum may develop in case ORANGE exceeds the upper Bollinger band and the last fractal high at 141. This level may serve as an entry point. The initial stop loss may be placed below the last fractal low, the Parabolic signal and the 15-month low at 125. After opening the pending order, we shall move the stop to the next fractal low following the Bollinger and Parabolic signals. Thus, we are changing the potential profit/loss to the breakeven point. More risk-averse traders may switch to the 4-hour chart after the trade and place there a stop loss moving it in the direction of the trade. If the price meets the stop level at 125 without reaching the order at 141 we recommend cancelling the position: the market sustains internal changes that were not taken into account.
Summary of technical analysis:
| Position | Buy |
| Buy stop | Above 141 |
| Stop loss | Below 125 |