
No bullish developments for soybean prices yet
Expected record US, South American and Chinese crops and favorable weather are bearish for soybeans. Will soybean prices continue the decline?
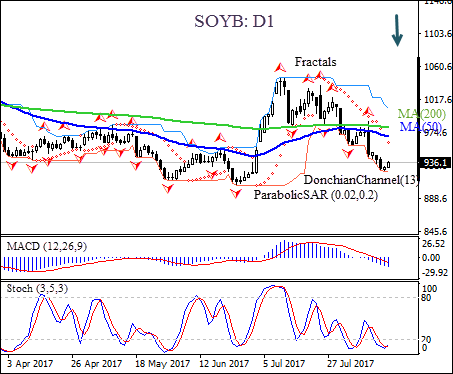
On the daily timeframe, SOYBEAN: D1 has been trading with negative bias after retracing to seven-month high in mid-May. The price is below the 50-day moving average MA(50) which is under the 200-day moving average MA(200), with both averages starting to decline as the gap between the two widens. This is also bearish.
- The Donchian channel is tilted downward indicating downtrend.
- The MACD indicator is below the signal line and the gap is widening, which is bearish.
- The Parabolic indicator has formed a sell signal.
- The stochastic oscillator is rising from the oversold zone, this is a bullish signal.
We believe the bearish momentum will continue after the price closes below the lower boundary of Donchian channel at 923.5. This level can be used as an entry point for placing a pending order to sell. The stop loss can be placed above last fractal high at 989.4. After placing the order, the stop loss is to be moved every day to the next fractal high, following Parabolic signals. Thus, we are changing the probable profit/loss ratio to the breakeven point. If the price meets the stop loss level (989.4) without reaching the order (923.5), we recommend cancelling the position: the market has undergone internal changes which were not taken into account.
Summary of technical analysis:
| Position | Sell |
| Sell stop | Below 923.5 |
| Stop loss | Above 989.4 |